Accessing the monitor dashboard
- From an administrative account on GitHub Enterprise Server, click in the upper-right corner of any page.

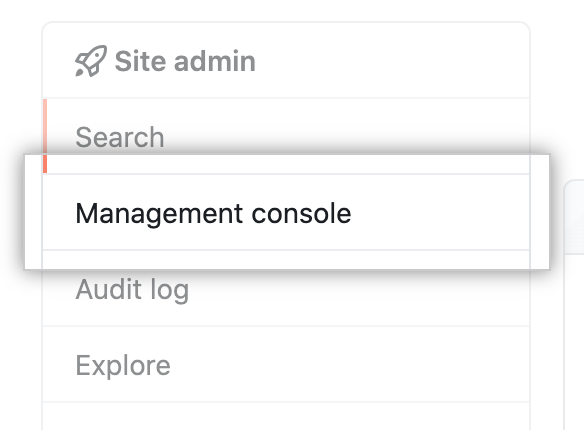
- In the left sidebar, click Management Console.

- At the top of the page, click Monitor.

Troubleshooting common resource allocation problems on your appliance
Note: Because regularly polling your GitHub Enterprise Server instance with continuous integration (CI) or build servers can effectively cause a denial of service attack that results in problems, we recommend using webhooks to push updates. For more information, see "About webhooks".
Use the monitor dashboard to stay informed on your appliance's resource health and make decisions on how to fix high usage issues.
| Problem | Possible cause(s) | Recommendations |
|---|---|---|
| High CPU usage | VM contention from other services or programs running on the same host | If possible, reconfigure other services or programs to use fewer CPU resources. To increase total CPU resources for the VM, see "Increasing CPU or memory resources." |
| High memory usage | VM contention from other services or programs running on the same host | If possible, reconfigure other services or programs to use less memory. To increase the total memory available on the VM, see "Increasing CPU or memory resources." |
| Low disk space availability | Large binaries or log files consuming disk space | If possible, host large binaries on a separate server, and compress or archive log files. If necessary, increase disk space on the VM by following the steps for your platform in "Increasing storage capacity." |
| Higher than usual response times | Often caused by one of the above issues | Identify and fix the underlying issues. If response times remain high, contact GitHub Enterprise Support or GitHub Premium Support. |
| Elevated error rates | Software issues | Contact GitHub Enterprise Support or GitHub Premium Support and include your support bundle. For more information, see "Providing data to GitHub Enterprise Support." |