About creating diagrams
You can create diagrams in Markdown using four different syntaxes: mermaid, geoJSON, topoJSON, and ASCII STL. Diagram rendering is available in GitHub Issues, GitHub Discussions, pull requests, wikis, and Markdown files.
Creating Mermaid diagrams
Mermaid is a Markdown-inspired tool that renders text into diagrams. For example, Mermaid can render flow charts, sequence diagrams, pie charts and more. For more information, see the Mermaid documentation.
To create a Mermaid diagram, add Mermaid syntax inside a fenced code block with the mermaid language identifier. For more information about creating code blocks, see Creating and highlighting code blocks.
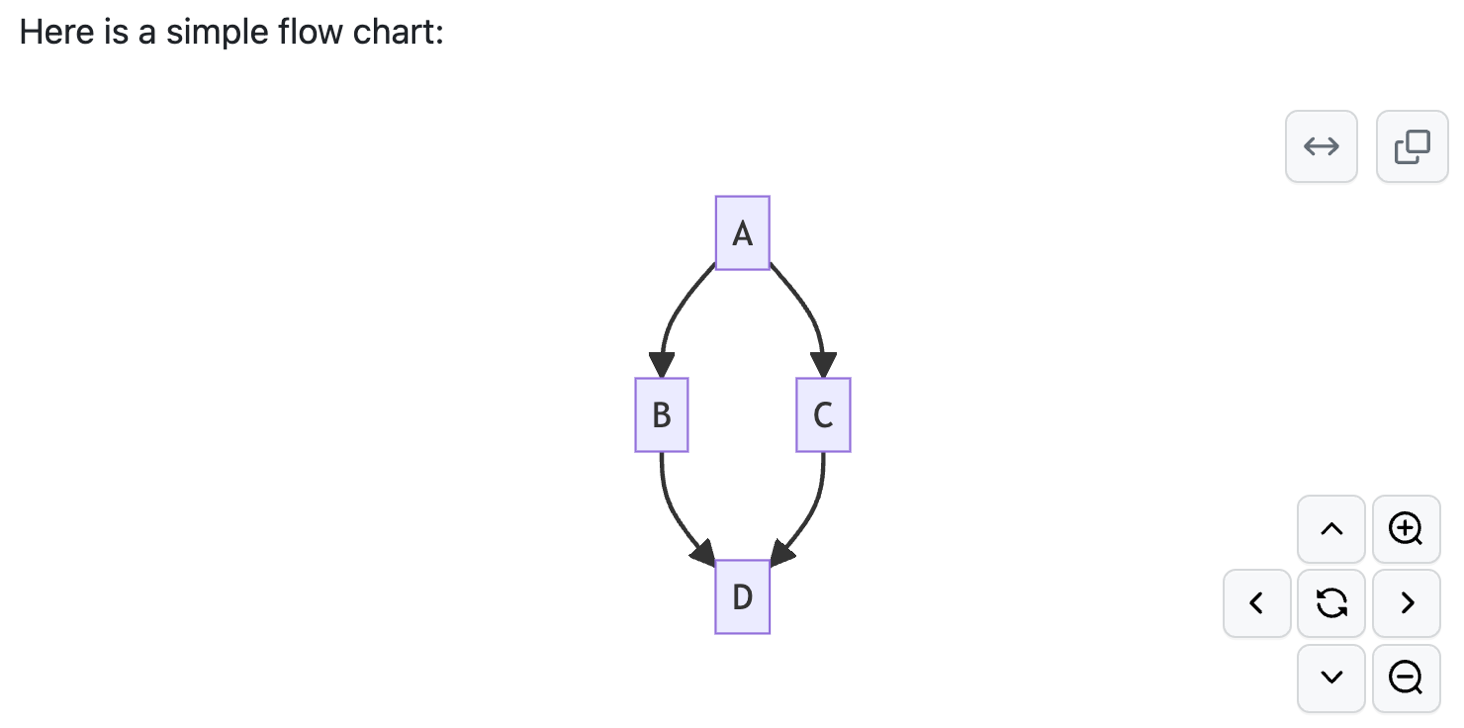
For example, you can create a flow chart by specifying values and arrows.
Here is a simple flow chart:

```mermaid
graph TD;
    A-->B;
    A-->C;
    B-->D;
    C-->D;
```

Note
You may observe errors if you run a third-party Mermaid plugin when using Mermaid syntax on GitHub.
Checking your version of Mermaid
To ensure GitHub supports your Mermaid syntax, check the Mermaid version currently in use.
```mermaid
  info
```
Creating GeoJSON and TopoJSON maps
You can use GeoJSON or TopoJSON syntax to create interactive maps. To create a map, add GeoJSON or TopoJSON inside a fenced code block with the geojson or topojson syntax identifier. For more information, see Creating and highlighting code blocks.
Note
GeoJSON and TopoJSON maps are not available on subdomains of GHE.com, such as octocorp.ghe.com.
Using GeoJSON
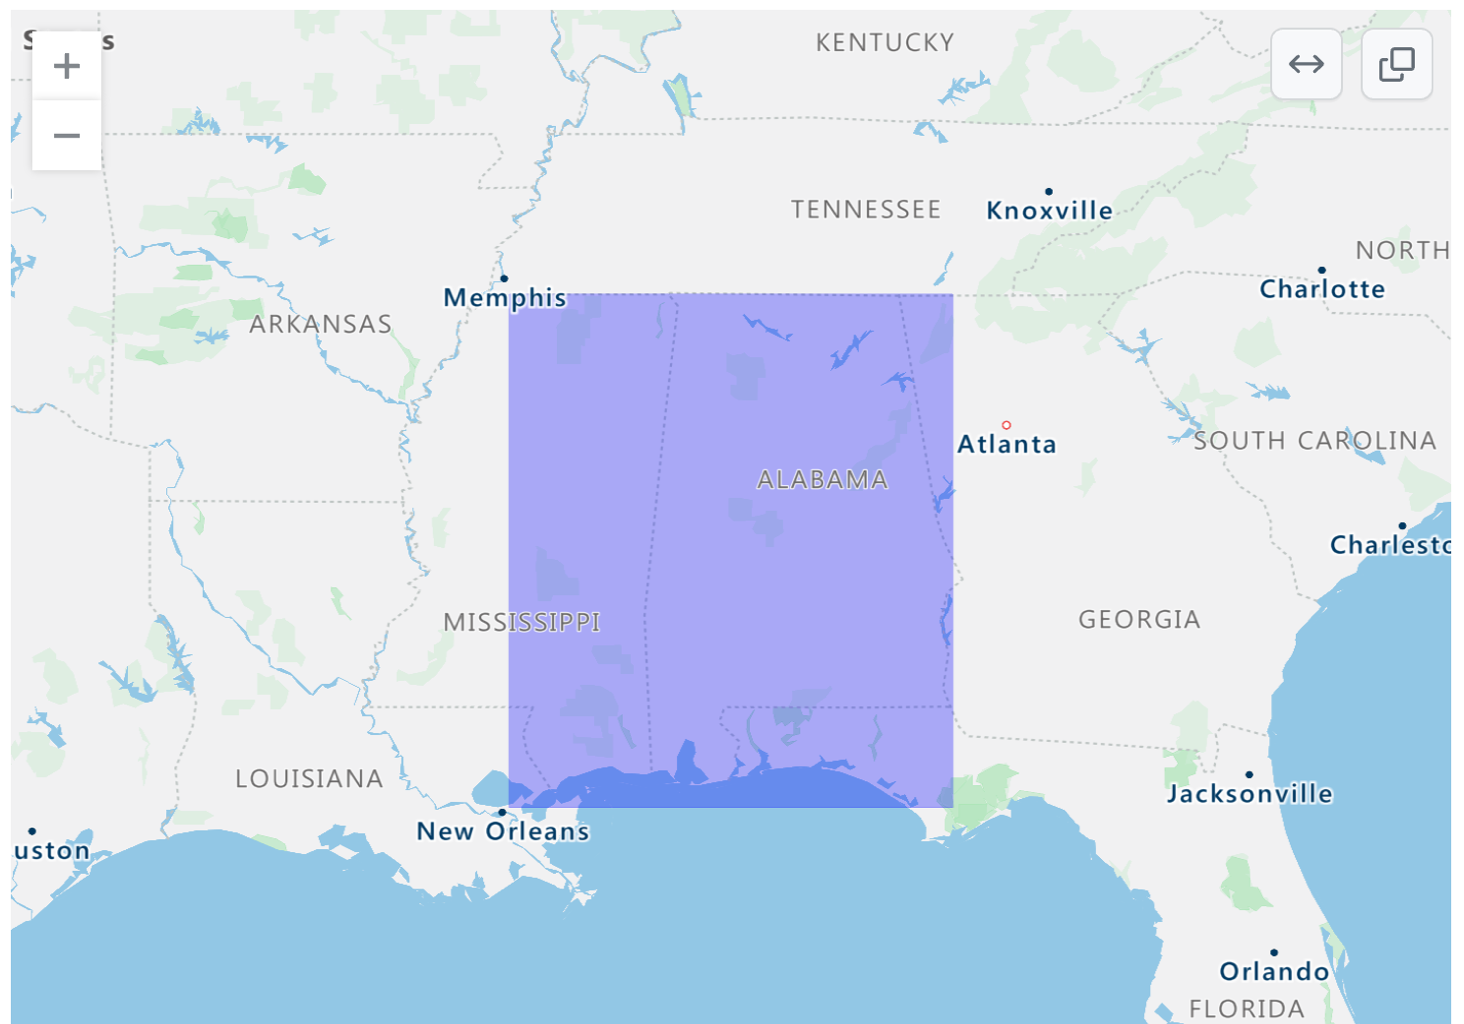
For example, you can create a map by specifying coordinates.
```geojson
{
  "type": "FeatureCollection",
  "features": [
    {
      "type": "Feature",
      "id": 1,
      "properties": {
        "ID": 0
      },
      "geometry": {
        "type": "Polygon",
        "coordinates": [
          [
              [-90,35],
              [-90,30],
              [-85,30],
              [-85,35],
              [-90,35]
          ]
        ]
      }
    }
  ]
}
```

Using TopoJSON
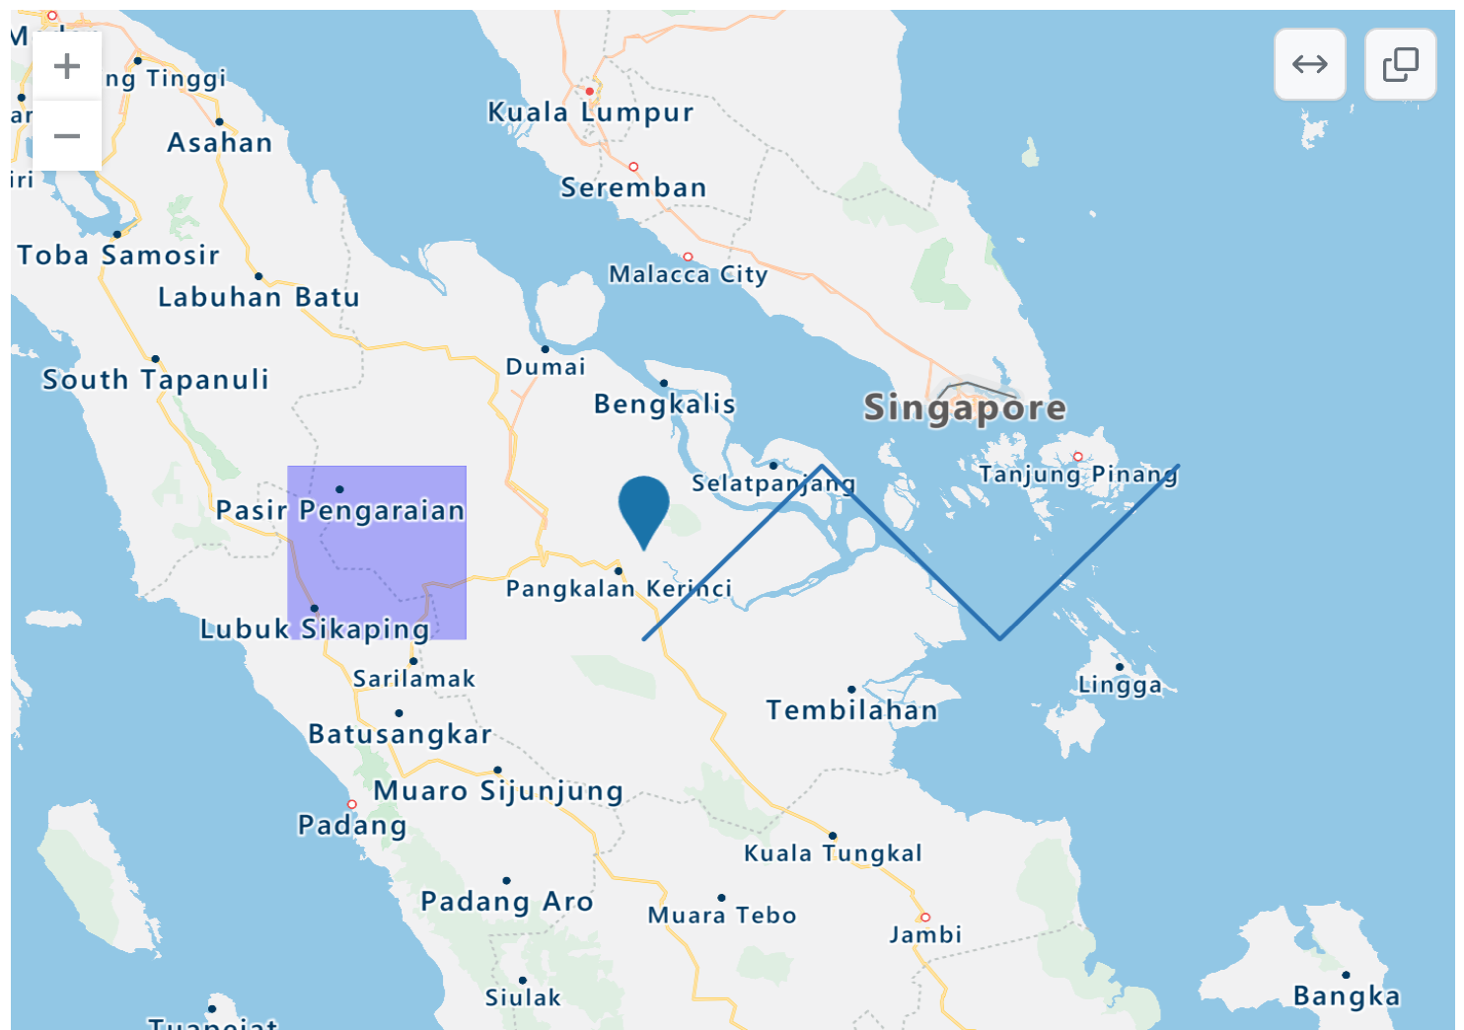
For example, you can create a TopoJSON map by specifying coordinates and shapes.
```topojson
{
  "type": "Topology",
  "transform": {
    "scale": [0.0005000500050005, 0.00010001000100010001],
    "translate": [100, 0]
  },
  "objects": {
    "example": {
      "type": "GeometryCollection",
      "geometries": [
        {
          "type": "Point",
          "properties": {"prop0": "value0"},
          "coordinates": [4000, 5000]
        },
        {
          "type": "LineString",
          "properties": {"prop0": "value0", "prop1": 0},
          "arcs": [0]
        },
        {
          "type": "Polygon",
          "properties": {"prop0": "value0",
            "prop1": {"this": "that"}
          },
          "arcs": [[1]]
        }
      ]
    }
  },
  "arcs": [[[4000, 0], [1999, 9999], [2000, -9999], [2000, 9999]],[[0, 0], [0, 9999], [2000, 0], [0, -9999], [-2000, 0]]]
}
```

For more information on working with .geojson and .topojson files, see Working with non-code files.
Creating STL 3D models
You can use ASCII STL syntax directly in markdown to create interactive 3D models. To display a model, add ASCII STL syntax inside a fenced code block with the stl syntax identifier. For more information, see Creating and highlighting code blocks.
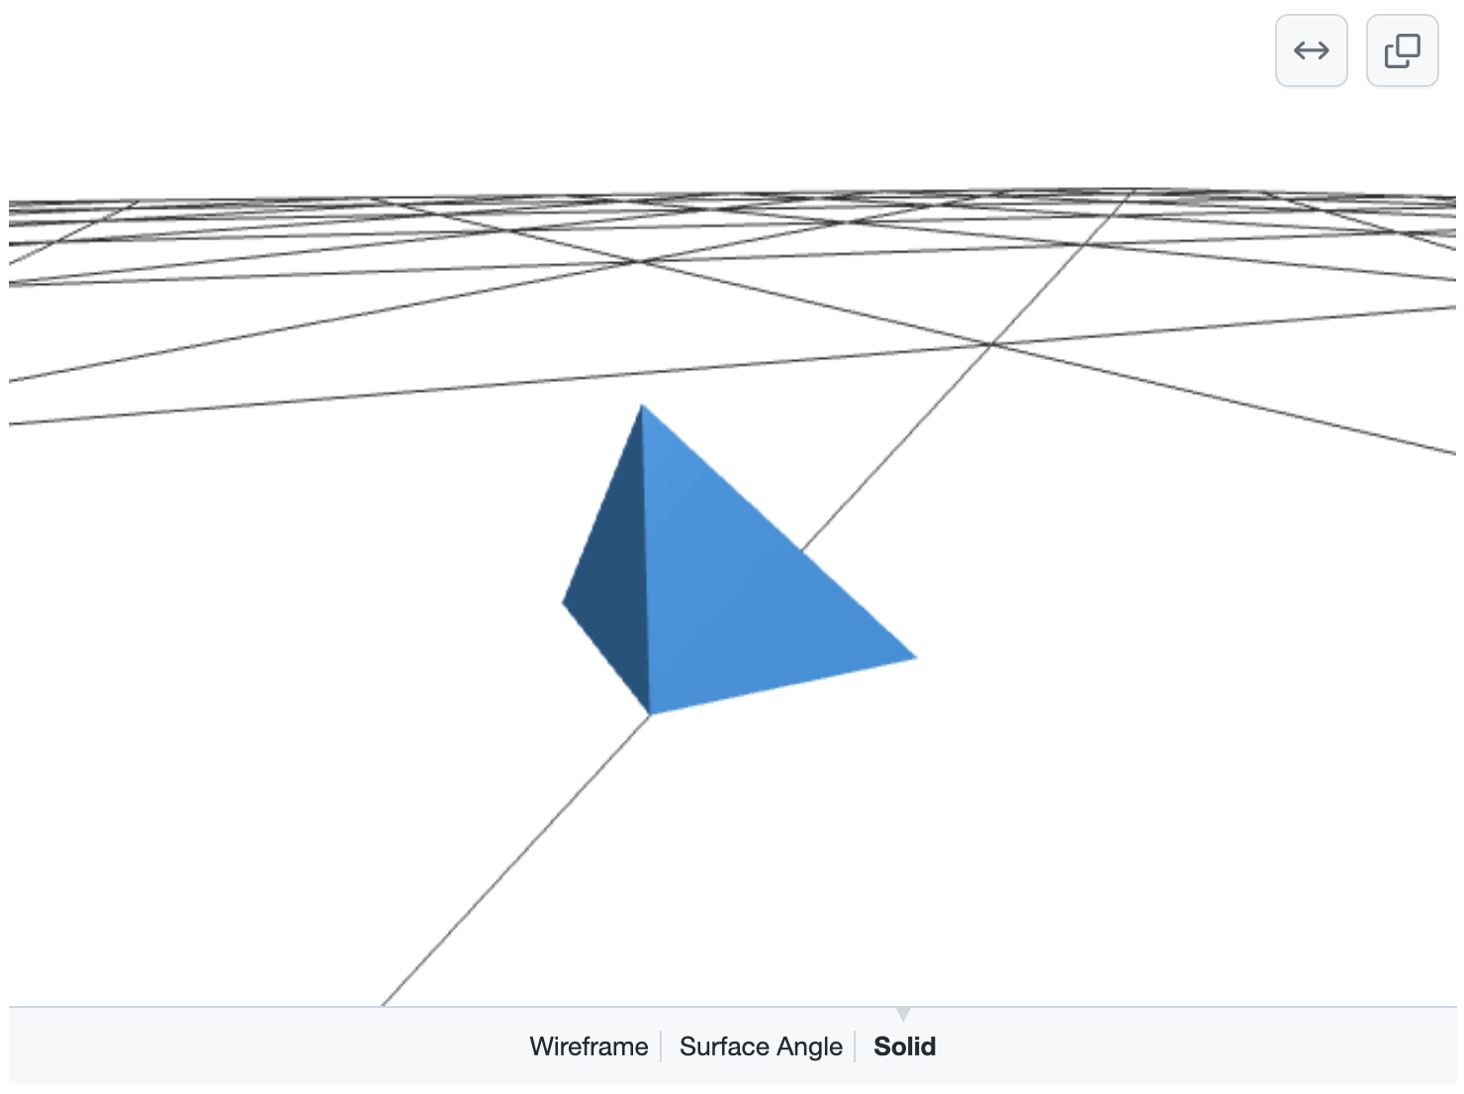
For example, you can create a simple 3D model:
```stl
solid cube_corner
  facet normal 0.0 -1.0 0.0
    outer loop
      vertex 0.0 0.0 0.0
      vertex 1.0 0.0 0.0
      vertex 0.0 0.0 1.0
    endloop
  endfacet
  facet normal 0.0 0.0 -1.0
    outer loop
      vertex 0.0 0.0 0.0
      vertex 0.0 1.0 0.0
      vertex 1.0 0.0 0.0
    endloop
  endfacet
  facet normal -1.0 0.0 0.0
    outer loop
      vertex 0.0 0.0 0.0
      vertex 0.0 0.0 1.0
      vertex 0.0 1.0 0.0
    endloop
  endfacet
  facet normal 0.577 0.577 0.577
    outer loop
      vertex 1.0 0.0 0.0
      vertex 0.0 1.0 0.0
      vertex 0.0 0.0 1.0
    endloop
  endfacet
endsolid
```

For more information on working with .stl files, see Working with non-code files.