About the roadmap layout
The roadmap layout provides a high-level visualization of your project across a configurable timespan, and allows you to drag items to affect their start and target dates or selected iteration. Roadmaps use your custom date and iteration fields to position your issues, pull requests, and draft issues on a timeline, allowing you to track work over time and watch progress.
You can also display vertical lines to highlight key dates for your project, including iterations, milestones, and the dates of items in your project. These markers help you get a clear overview of your upcoming workload and how it's distributed across iterations or milestones.
For more information about changing a view to use the roadmap layout, see Changing the layout of a view.
Setting the start and target date fields
You can set the date or iteration fields that your roadmap will use to position items. When you set a view to a roadmap layout, GitHub will attempt to use existing date and iteration fields you have already set up. For more information on creating new fields, see About date fields and About iteration fields.
-
In the top right of your roadmap, click Date fields.

-
Optionally, to create a new date or iteration field, click New field, type the name of your field, and click Save. You can then select the new field or create another.
-
Select a date or iteration field for "Start date" and "Target date."

Setting vertical markers
You can configure vertical markers on a roadmap to show your iterations, the dates of items in your project, and the milestones associated with items in your project.
-
In the top right of your roadmap, click Markers.

-
In the menu, select which markers you want to display on your roadmap.

Setting the zoom level
You can choose the density of items on your roadmap. You can zoom in to show one month at a time or, for a greater overview, you can zoom out to show a quarter of a year or a full year.
-
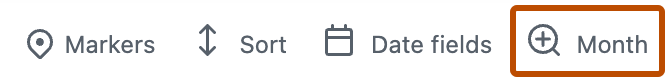
In the top right of your roadmap, click .
-
Select either Month, Quarter, or Year.

Slicing by field values
You can slice your items by a field to view a list of the field values in a separate panel. When you click on a value in the slice panel, the current view will adjust to only show items with that value. The slice panel works with the current filter applied to your view.
Note
You cannot slice by title, reviewers, or linked pull requests.
-
Click next to the name of the currently open view.

-
Click Slice by.
-
Click the field you want to slice by.
-
Optionally, to disable slicing, click No slicing at the bottom of the list.
With the slice panel open, you can change the current field by using the menu at the top of the slice panel.
Sorting by field values
You can sort items by a field value.
-
Click next to the name of the currently open view.
-
Click Sort.
-
Click the field you want to sort by.
-
Optionally, to add a secondary sort, click another field.
-
Optionally, to change the direction of the sort for either field, click the field again.

-
Optionally, to remove a sort, click one of the sorted fields, or click No sorting at the bottom of the list.

Grouping by field values
You can group items by a custom field value.
Note
You cannot group by title, labels, reviewers, or linked pull requests.
-
Click next to the name of the currently open view.
-
Click Group by.
-
Click the field you want to group by.
-
Optionally, to disable grouping, click No grouping at the bottom of the list.
Showing the sum of a number field
You can configure a view to show the sum of one of more number fields, including a count of items in the group or column. For example, if you have a number field tracking the number of hours each item may take to complete, you can display of sum of those hours for each group or column.
In a board layout, field sums are displayed at the top of each column. In table and roadmap layouts, when you enable grouping by a field, field sums are included in each group's header.
-
Click next to the name of the currently open view.
-
Click Field sum.
-
Select the fields you want to include.