Note: GitHub-hosted runners are not currently supported on GitHub Enterprise Server. You can see more information about planned future support on the GitHub public roadmap.
-
On your GitHub Enterprise Server instance, navigate to the main page of the repository.
-
Under your repository name, click Actions.

-
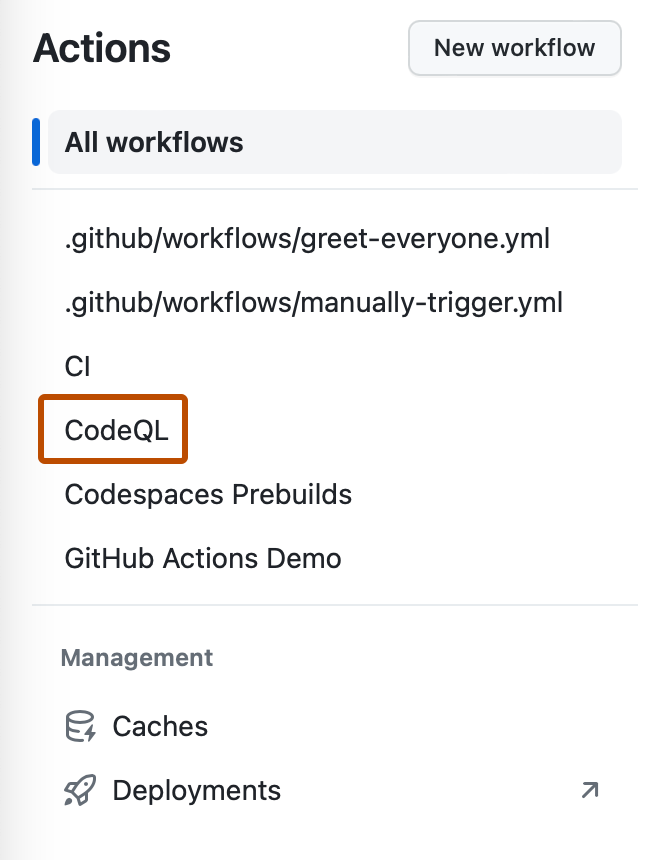
In the left sidebar, click the workflow you want to see.
-
From the list of workflow runs, click the name of the run to see the workflow run summary.
-
The graph displays each job in the workflow. An icon to the left of the job name indicates the status of the job. Lines between jobs indicate dependencies.

-
To view a job's log, click the job.


