Эта версия GitHub Enterprise Server будет прекращена 2023-12-20. Исправления выпускаться не будут даже при критических проблемах безопасности. Для повышения производительности, повышения безопасности и новых функций выполните обновление до последней версии GitHub Enterprise Server. Чтобы получить справку по обновлению, обратитесь в службу поддержки GitHub Enterprise.

Анализ изменений в содержимом репозитория

Вы можете просмотреть изменения содержимого в репозитории, проанализировав фиксации репозитория, частоту фиксаций, а также операции добавления и удаления содержимого.

This repository insights graph is available in public repositories with GitHub Free and GitHub Free for organizations, and in public and private repositories with GitHub Pro, GitHub Team, GitHub Enterprise Cloud, and GitHub Enterprise Server.

Visualizing commits in a repository

You can see all commits made to a repository in the past year (excluding merge commits) in the Commit graph.

The top graph shows commits for the entire year by week. The bottom graph shows the average number of commits by day of the week for the selected week.
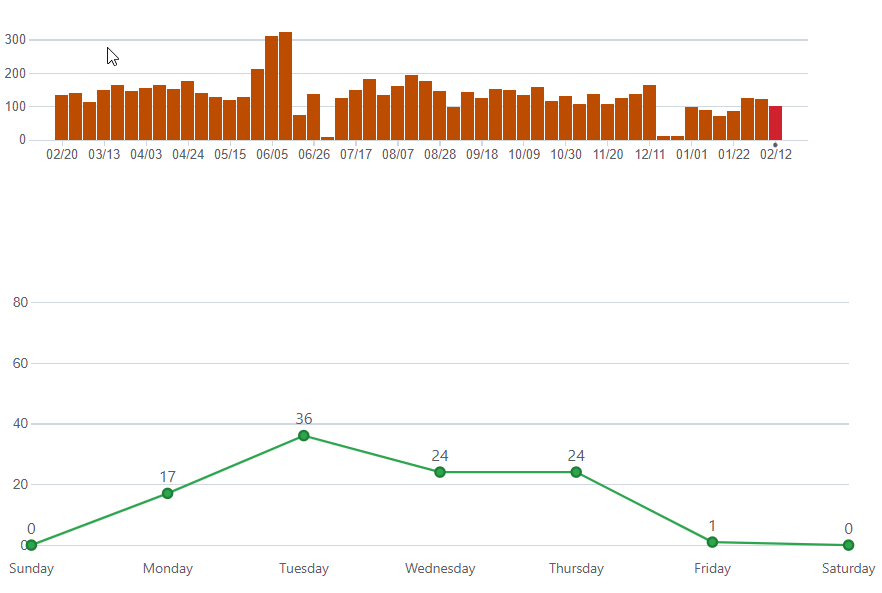
Screenshot of both the repository commit graphs, showing a yearly and then a weekly view.

Accessing the commits graph

  1. On your GitHub Enterprise Server instance, navigate to the main page of the repository.

  2. Under your repository name, click Insights.

    Screenshot of the main page of a repository. In the horizontal navigation bar, a tab, labeled with a graph icon and "Insights," is outlined in dark orange.

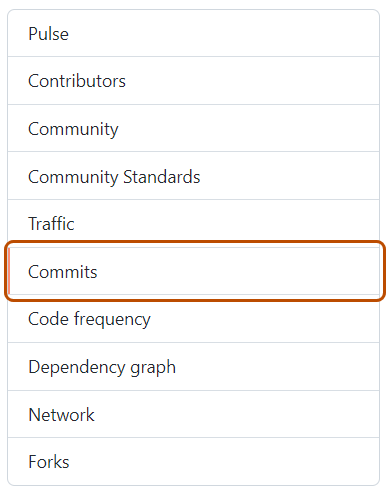
  3. In the left sidebar, click Commits. Screenshot of the left sidebar. The "Commits" tab is highlighted with a dark orange outline.

Visualizing additions and deletion to content in a repository

The code frequency graph displays the content additions and deletions for each week in a repository's history.

Accessing the code frequency graph

  1. On your GitHub Enterprise Server instance, navigate to the main page of the repository.

  2. Under your repository name, click Insights.

    Screenshot of the main page of a repository. In the horizontal navigation bar, a tab, labeled with a graph icon and "Insights," is outlined in dark orange.

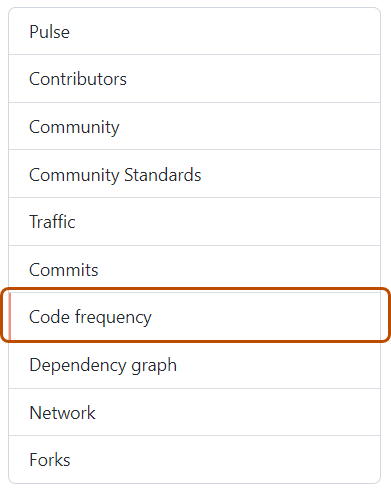
  3. In the left sidebar, click Code frequency. Screenshot of the left sidebar. The "Code frequency" tab is highlighted with a dark orange outline.