Viewing key metrics and reports
You can view and filter key metrics and reports to help you understand and improve your software delivery process through data.
GitHub Insights is available with GitHub One. Para obtener más información, consulta "Productos de GitHub".
En este artículo
About metrics and reports
Data available in GitHub Insights are divided into key metrics and reports. For more information about available metrics, see "Metrics available with GitHub Insights."
You will only have access to the GitHub Insights data which you also have access to in GitHub Enterprise.
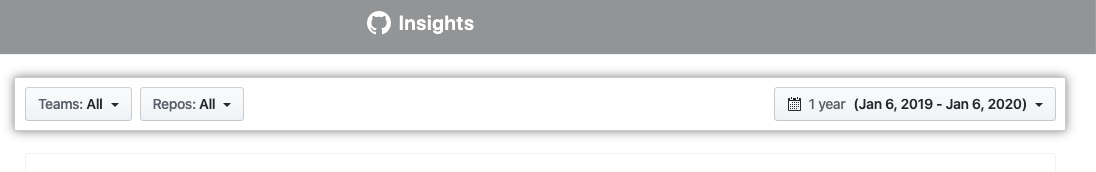
You can filter the data included in key metrics or reports by teams, repositories, or date range.
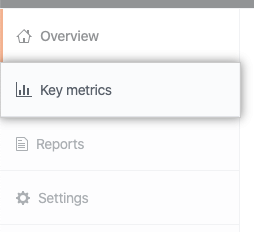
Viewing key metrics
-
In GitHub Insights, click Key metrics.
-
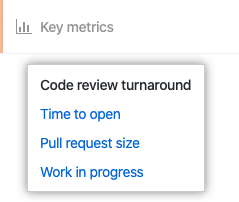
Under Key metrics, click the name of the metric you want to view.
-
Optionally, to filer all the metrics on the page, above the metrics, use the "Teams", "Repos", or date range drop-down menus.
-
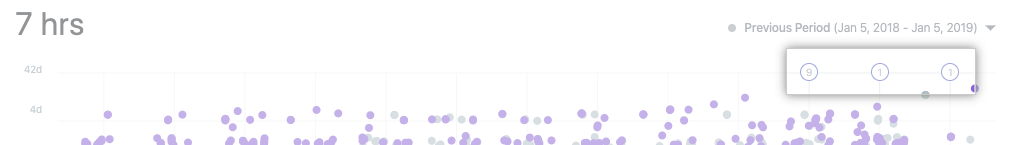
Optionally, to view the events that occurred during a period, click the numbered circle over that period.
Viewing reports
-
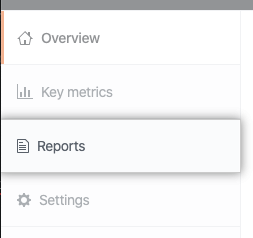
In GitHub Insights, click Reports.
-
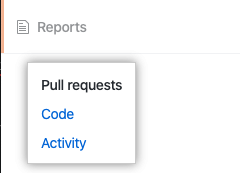
Under Reports, click the name of the report you want to view.
-
Optionally, to filer all the metrics on the page, above the metrics, use the "Teams", "Repos", or date range drop-down menus.
-
Optionally, to view the events that occurred during a period, click the numbered circle over that period.