Viewing key metrics and reports
You can view and filter key metrics and reports to help you understand and improve your software delivery process through data.
GitHub Insights 可用于 GitHub One。 更多信息请参阅“GitHub 的产品”。
本文内容
About metrics and reports
GitHub Insights 中可用的数据分为关键指标和报告。 For more information about available metrics, see "Metrics available with GitHub Insights."
You will only have access to the GitHub Insights data which you also have access to in GitHub Enterprise.
You can filter the data included in key metrics or reports by teams, repositories, or date range.
Viewing key metrics
-
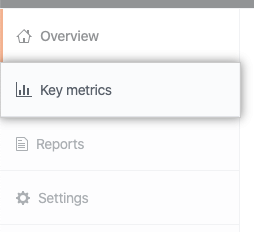
In GitHub Insights, click Key metrics.
-
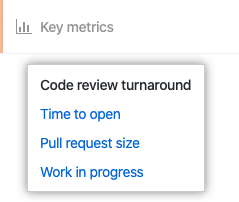
Under Key metrics, click the name of the metric you want to view.
-
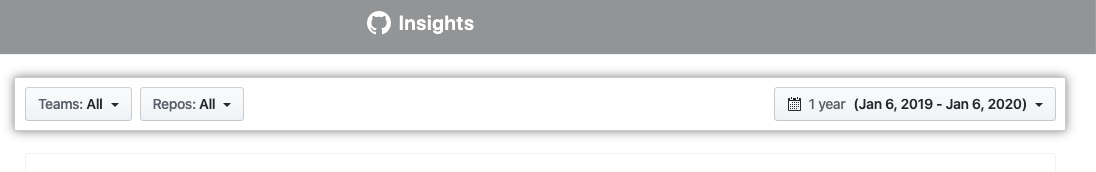
(可选)要过滤页面上的所有指标,请使用“Teams(团队)”、“Repos(仓库)”或日期范围下拉菜单。
-
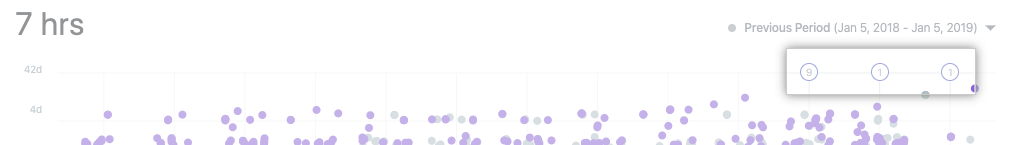
(可选)要查看一段时间内发生的事件,请单击该时间段内的编号圆圈。
Viewing reports
-
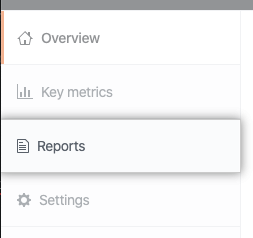
In GitHub Insights, click Reports.
-
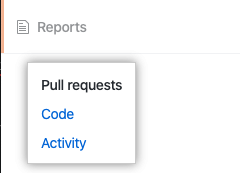
Under Reports, click the name of the report you want to view.
-
(可选)要过滤页面上的所有指标,请使用“Teams(团队)”、“Repos(仓库)”或日期范围下拉菜单。
-
(可选)要查看一段时间内发生的事件,请单击该时间段内的编号圆圈。