Recopilación de archivos de registro
La ubicación de los archivos de registro dependerá del IDE de JetBrains que estés usando. Para obtener más información, vea «Configuración de GitHub Copilot en tu entorno».
En estos pasos se describe cómo ver y recopilar los archivos de registro de los IDE de JetBrains siguientes:
- IntelliJ IDEA
- Android Studio
- GoLand
- PhpStorm
- PyCharm
- RubyMine
- WebStorm
La extensión GitHub Copilot se registra en la ubicación del registro IDEA para complementos de IntelliJ.
- En el IDE de JetBrains, abre el menú Ayuda.
- Ve a Mostrar inicio de sesión en Finder.
- Abre
idea.logen el editor que prefieras y busca los errores relacionados con GitHub o GitHub Copilot.
Para obtener más información, consulta el documento sobre búsqueda de archivos de registro del IDE en la documentación de IntelliJ.
Recopilación de archivos de registro de Rider
- En Rider, abre el menú Ayuda.
- Ve a Herramientas de diagnóstico.
- Ve a Mostrar inicio de sesión.
- Abre
idea.logen el editor que prefieras y busca los errores relacionados con GitHub o GitHub Copilot.
Habilitación del modo de depuración
Si te parece que el archivo de registro no contiene suficiente información para resolver un problema, puede ser útil habilitar temporalmente el registro de depuración. Esto puede ser especialmente útil para depurar problemas relacionados con la red.
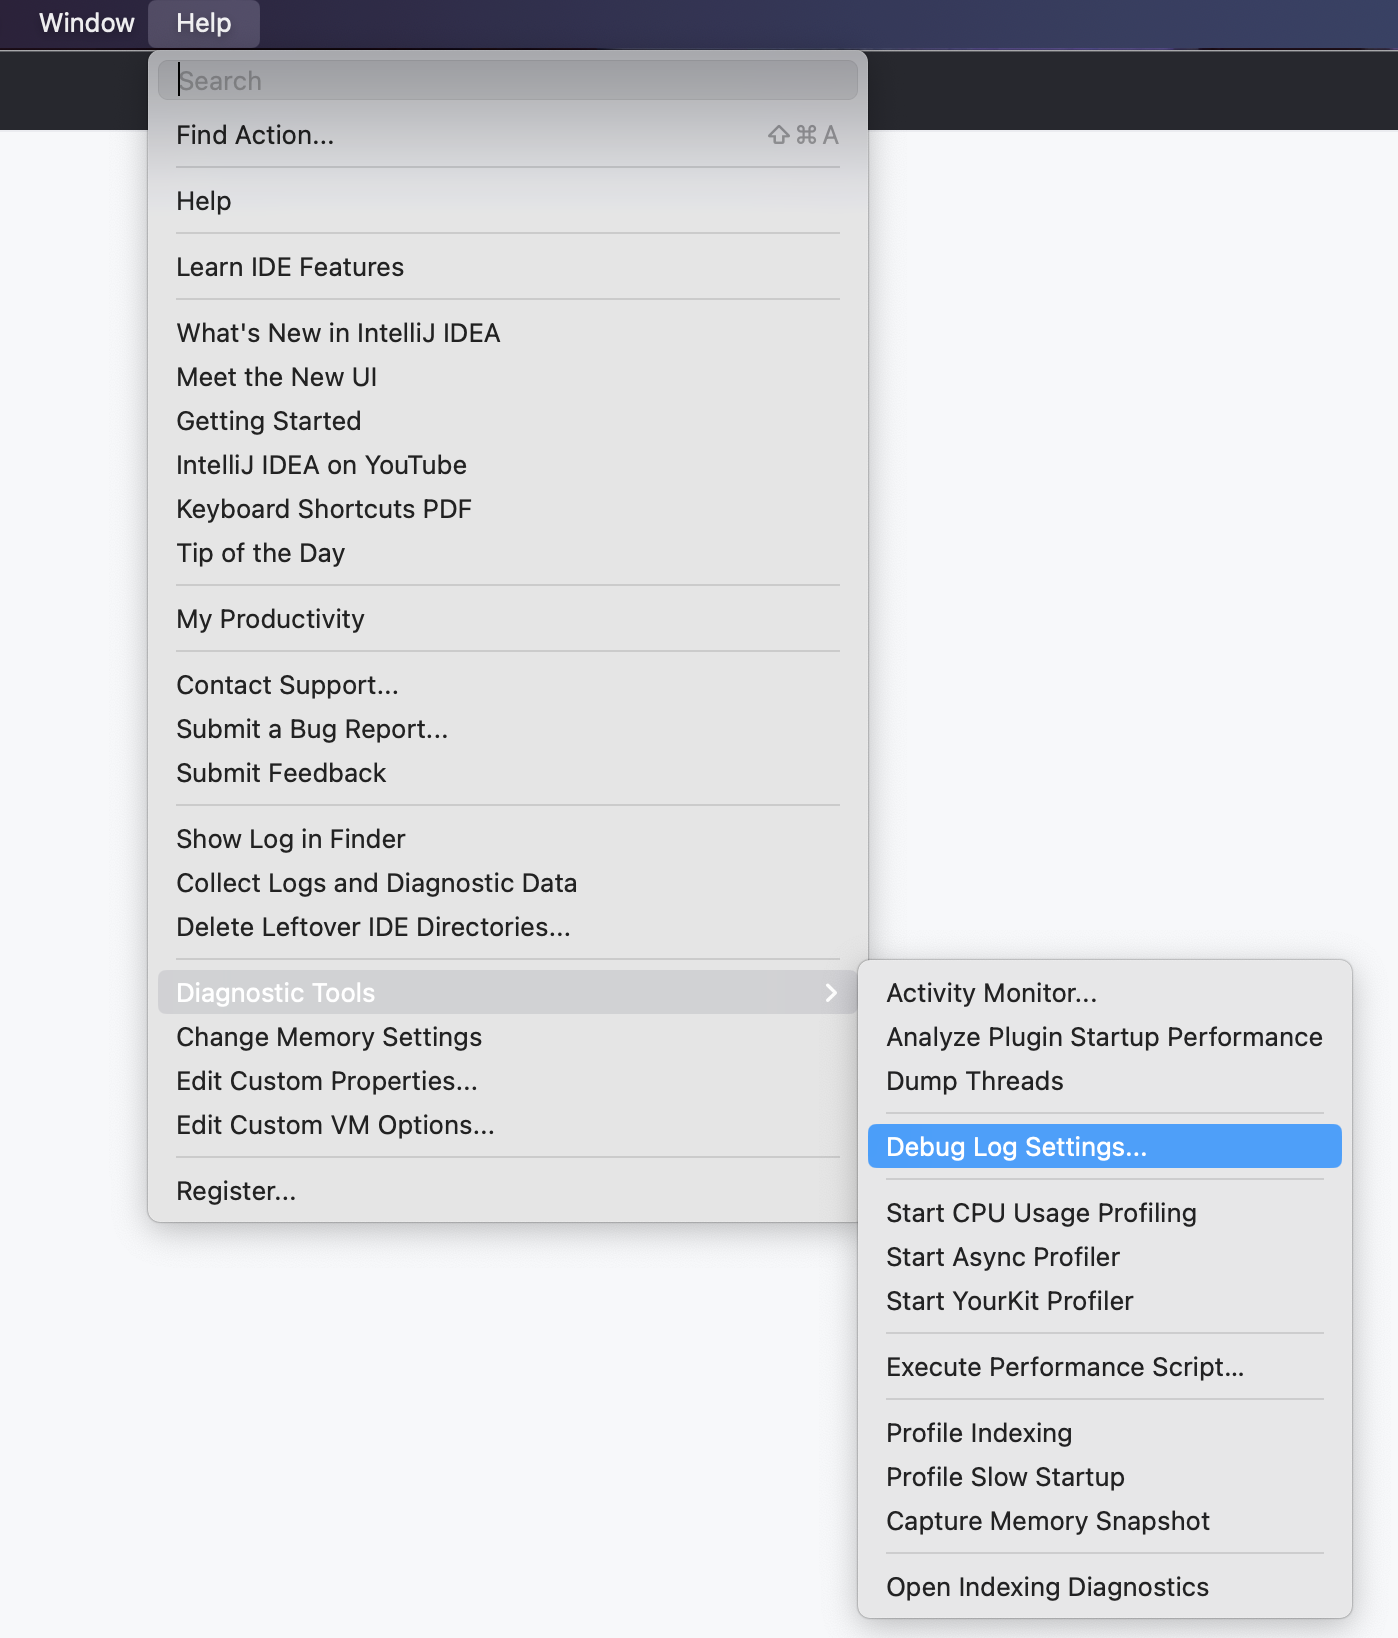
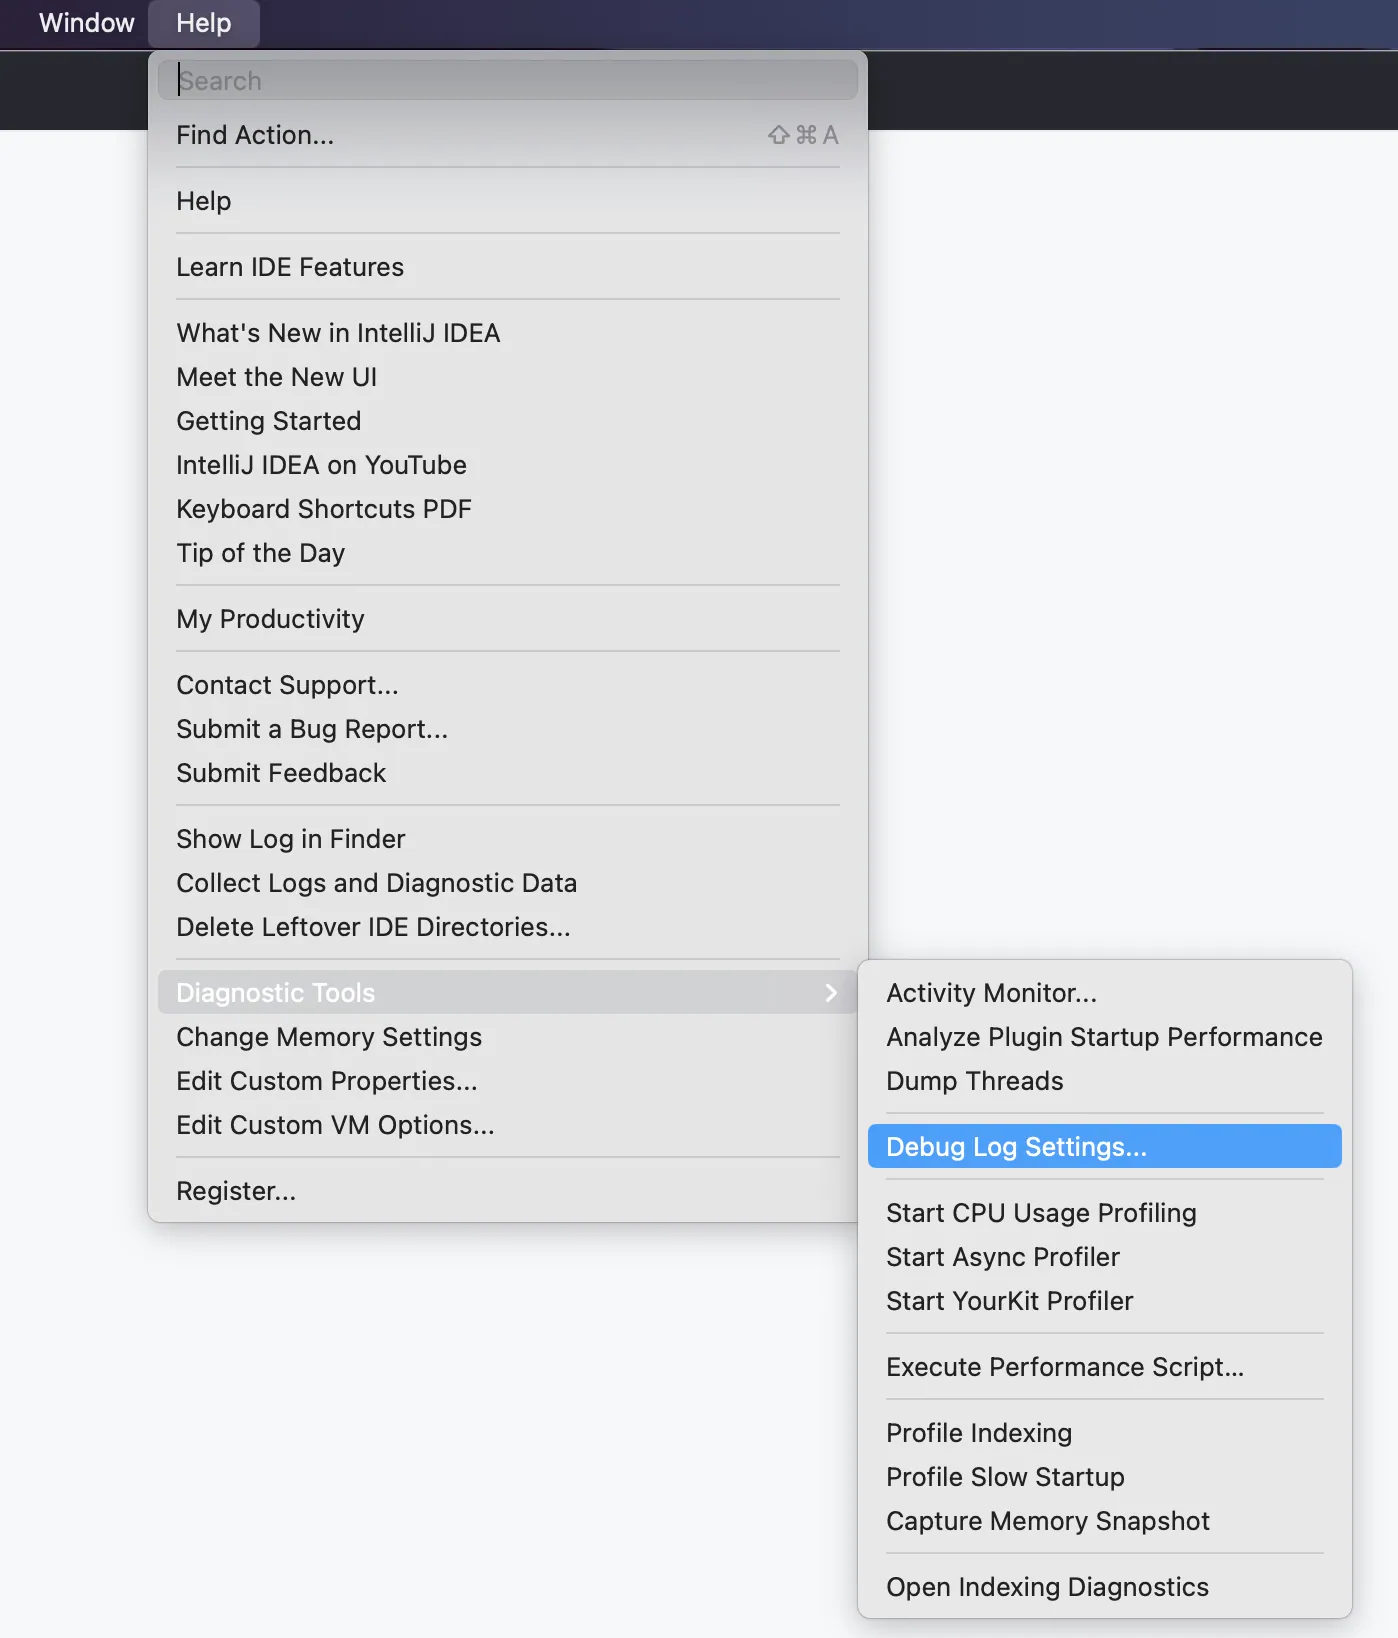
-
En la barra de menús, haz clic en Ayuda, selecciona Herramientas de diagnóstico y haz clic en Configuración del registro de depuración....
-
En la ventana “Configuración personalizada del registro de depuración”, agrega una nueva línea con el siguiente contenido y, a continuación, haz clic en Aceptar.
Text #com.github.copilot:trace
#com.github.copilot:trace -
Sigue usando el IDE hasta que se vuelva a producir el problema y, a continuación, recopila el archivo de registro como se describe en “Recopilación de archivos de registro”.
-
Cuando tengas la información que necesitas, deshabilita el modo de depuración quitando
#com.github.copilot:tracede la ventana "Configuración personalizada del registro de depuración".
Visualización de los registros de diagnóstico de conectividad de red
Si tienes problemas para conectarte a GitHub Copilot debido a restricciones de red, firewalls o la configuración del proxy, sigue estos pasos de solución de problemas.
- En la barra de menús, haga clic en Herramientas, seleccione GitHub Copilot y haga clic en Diagnósticos de registro.
- El archivo
idea.logdebe abrirse en el IDE de JetBrains con la salida de diagnóstico. Como alternativa, puede abrir el archivoidea.logen su editor preferido. - Consulta la sección sobre Disponibilidad para determinar si GitHub Copilot puede acceder a los servicios necesarios.
Solución de errores relacionados con certificados
Si usa un certificado personalizado, asegúrese de que el certificado está instalado correctamente en el sistema operativo, consulte "Solución de errores de red para GitHub Copilot". A continuación, use los siguientes pasos de solución de problemas.
- En la barra de menús, haga clic en Herramientas, seleccione GitHub Copilot y haga clic en Certificado de entidad de certificación de registro.
- El archivo
idea.logdebe abrirse en el IDE de JetBrains con los certificado de entidad de certificación de confianza registrados en formato PEM. Es posible que tenga que actualizar el archivoidea.logpara ver toda la salida. Como alternativa, puede abrir el archivoidea.logen su editor preferido. - Compruebe si el certificado personalizado esperado se incluye en la salida de la lista de certificados.
Visualización de registros en Visual Studio
Los archivos de registro de la extensión GitHub Copilot se almacenan en la ubicación de registros estándar para las extensiones de Visual Studio.
- Abre el menú Ver en Visual Studio.
- Haz clic en Salida.
- A la derecha del panel de visualización de Salida, selecciona GitHub Copilot en el menú desplegable.
Información adicional
- "Registro de toda la actividad en el archivo de registro para solucionar problemas" en la documentación de Visual Studio
Visualización y recopilación de archivos de registro
Los archivos de registro de la extensión GitHub Copilot se almacenan en la ubicación de registros estándar para las extensiones de Visual Studio Code. Los archivos de registro son útiles para diagnosticar problemas de conexión.
- Abre el menú Ver en Visual Studio Code.
- Haz clic en Salida.
- A la derecha del panel de visualización de Salida, selecciona GitHub Copilot en el menú desplegable.
Como alternativa, puedes abrir la carpeta de registro para las extensiones de Visual Studio Code en el explorador de archivos del sistema. Esto es útil si necesitas reenviar los archivos de registro al equipo de soporte técnico.
- Apertura de VS Code Command Palette
- Para Mac:
- Presiona: Mayús+Comando+P
- Para Windows o Linux:
- Presiona: Ctrl+Mayús+P
- Para Mac:
- Escribe "Registros" y, después, selecciona Desarrollador: Abrir carpeta de registros de extensión en la lista.
Visualización de los registros de diagnóstico de conectividad de red
Si tienes problemas para conectarte a GitHub Copilot debido a restricciones de red, firewalls o la configuración del proxy, sigue estos pasos de solución de problemas.
- Apertura de VS Code Command Palette
- Para Mac:
- Presiona: Mayús+Comando+P
- Para Windows o Linux:
- Presiona: Ctrl+Mayús+P
- Para Mac:
- Escribe "Diagnósticos" y, después, selecciona GitHub Copilot: Recopilar diagnósticos en la lista. Se abre un nuevo editor con la información pertinente que puedes inspeccionar personalmente o compartir con el equipo de soporte técnico.
- Consulta la sección sobre Disponibilidad para determinar si GitHub Copilot puede acceder realmente a los servicios necesarios.
Visualización de registros de Electron
En algunos casos, es posible que los errores no se propaguen a los controladores de errores correspondientes y no se registren en las ubicaciones normales. Si encuentras errores y no hay nada en los registros, puedes intentar verlos en el proceso que ejecuta VS Code y la extensión.
-
Apertura de VS Code Command Palette
- Para Mac:
- Presiona: Mayús+Comando+P
- Para Windows o Linux:
- Presiona Ctrl+Mayús+P
- Para Mac:
-
Escribe "Alternar" y, después, selecciona Desarrollador: Alternar herramientas de desarrollo en la lista.
-
En la ventana Herramientas de desarrollo, selecciona la pestaña Consola para ver los errores o advertencias.


Información adicional
- "Solución de errores de red para GitHub Copilot"
- "Conexiones de red en Visual Studio Code" en la documentación de Visual Studio Code
Comprobación de su GitHub Copilot está operativo
Para comprobar si GitHub Copilot está operativo, ejecuta este comando en Vim/Neovim:
:Copilot status