Note: Your site administrator must enable code scanning for your GitHub Enterprise Server instance before you can use this feature. For more information, see "Configuring code scanning for your appliance."
You may not be able to enable or disable code scanning if an enterprise owner has set a GitHub Advanced Security (GHAS) policy at the enterprise level. For more information, see "Enforcing policies for code security and analysis for your enterprise."
About alerts from code scanning
You can configure code scanning to check the code in a repository using the default CodeQL analysis, a third-party analysis, or multiple types of analysis. When the analysis is complete, the resulting alerts are displayed alongside each other in the security view of the repository. Results from third-party tools or from custom queries may not include all of the properties that you see for alerts detected by GitHub's default CodeQL analysis. For more information, see "Configuring code scanning."
By default, code scanning analyzes your code periodically on the default branch and during pull requests. For information about managing alerts on a pull request, see "Triaging code scanning alerts in pull requests."
You can audit the actions taken in response to code scanning alerts using GitHub tools. For more information, see "Auditing security alerts."
About alert details
Each alert highlights a problem with the code and the name of the tool that identified it. You can see the line of code that triggered the alert, as well as properties of the alert, such as the alert severity, security severity, and the nature of the problem. Alerts also tell you when the issue was first introduced. For alerts identified by CodeQL analysis, you will also see information on how to fix the problem.
The status and details on the alert page only reflect the state of the alert on the default branch of the repository, even if the alert exists in other branches. You can see the status of the alert on non-default branches in the Affected branches section on the right-hand side of the alert page. If an alert doesn't exist in the default branch, the status of the alert will display as "in pull request" or "in branch" and will be colored grey.

If you configure code scanning using CodeQL, you can also find data-flow problems in your code. Data-flow analysis finds potential security issues in code, such as: using data insecurely, passing dangerous arguments to functions, and leaking sensitive information.
When code scanning reports data-flow alerts, GitHub shows you how data moves through the code. Code scanning allows you to identify the areas of your code that leak sensitive information, and that could be the entry point for attacks by malicious users.
About severity levels
Alert severity levels may be Error, Warning, or Note.
If code scanning is enabled as a pull request check, the check will fail if it detects any results with a severity of error. You can specify which severity level of code scanning alerts causes a check failure. For more information, see "Customizing code scanning."
About security severity levels
Code scanning displays security severity levels for alerts that are generated by security queries. Security severity levels can be Critical, High, Medium, or Low.
To calculate the security severity of an alert, we use Common Vulnerability Scoring System (CVSS) data. CVSS is an open framework for communicating the characteristics and severity of software vulnerabilities, and is commonly used by other security products to score alerts. For more information about how severity levels are calculated, see this blog post.
By default, any code scanning results with a security severity of Critical or High will cause a check failure. You can specify which security severity level for code scanning results should cause a check failure. For more information, see "Customizing code scanning."
About analysis origins
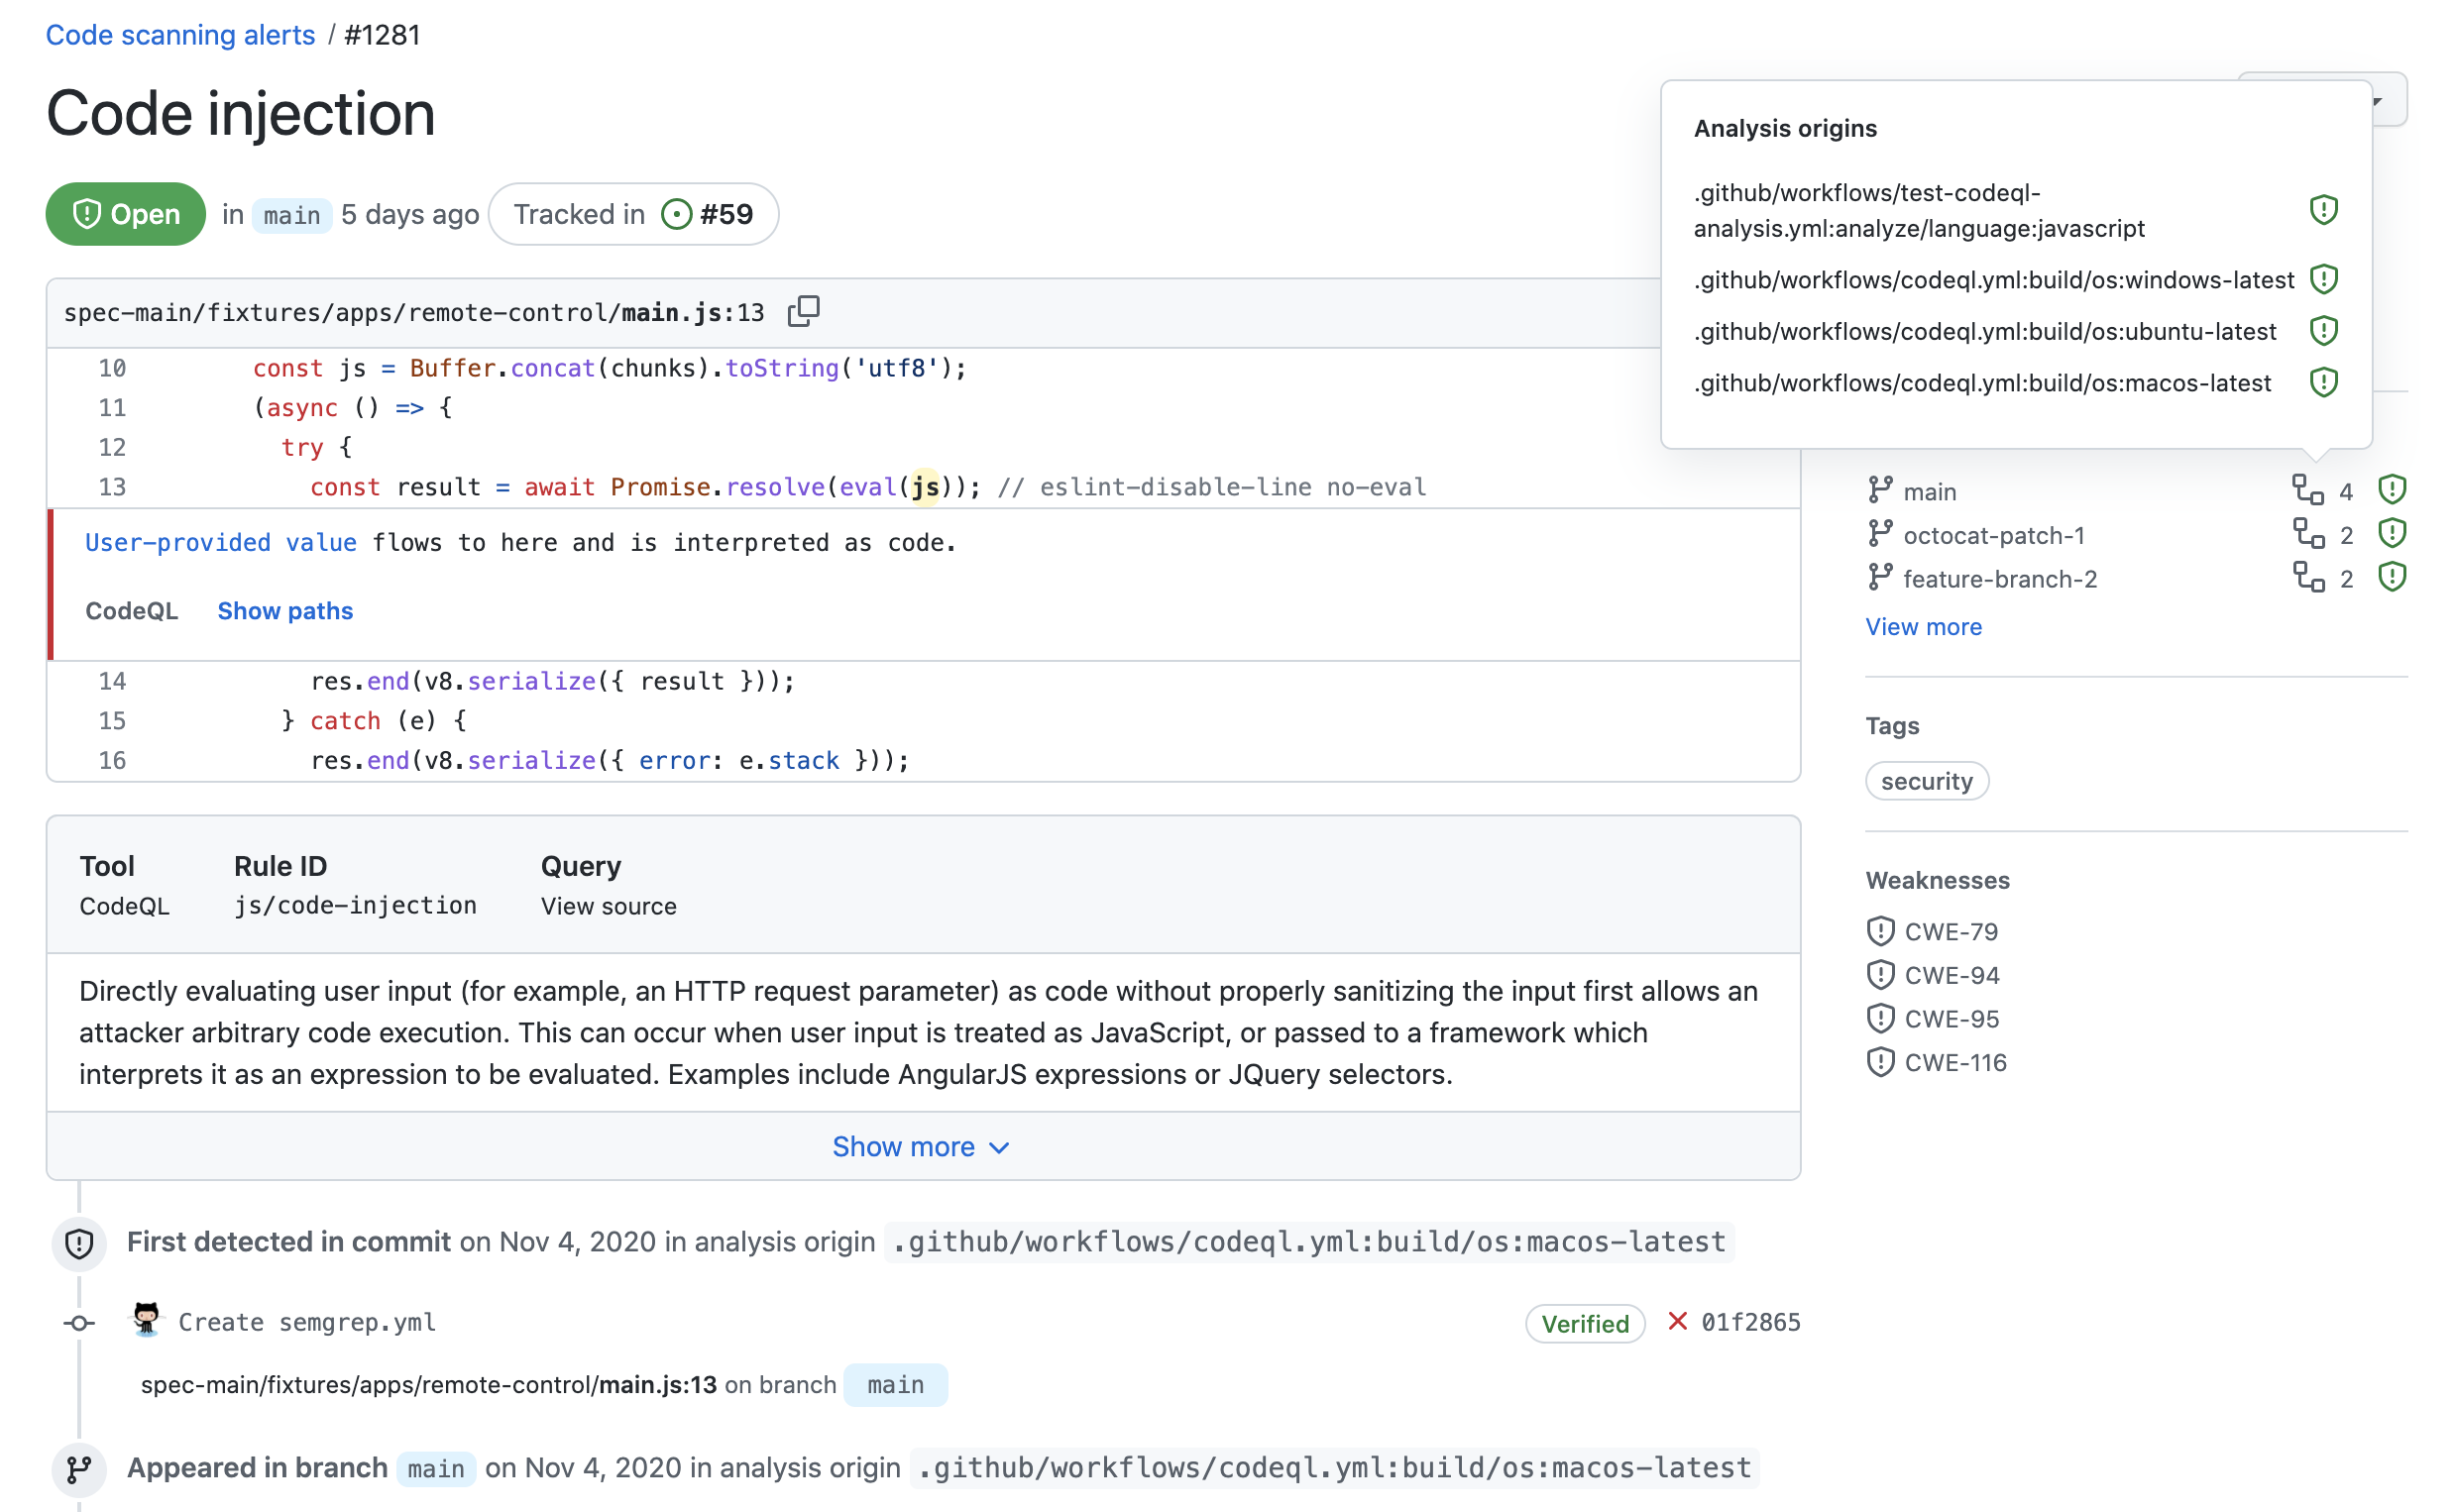
You can run multiple configurations of code analysis on a repository, using different tools and targeting different languages or areas of the code. Each configuration of code scanning is the analysis origin for all the alerts it generates. For example, an alert generated using the default CodeQL analysis with GitHub Actions will have a different analysis origin from an alert generated externally and uploaded via the code scanning API.
If you use multiple configurations to analyze a file, any problems detected by the same query are reported as alerts with multiple analysis origins. If an alert has more than one analysis origin, a icon will appear next to any relevant branch in the Affected branches section on the right-hand side of the alert page. You can hover over the icon to see the names of each analysis origin and the status of the alert for that analysis origin. You can also view the history of when alerts appeared in each analysis origin in the timeline on the alert page. If an alert only has one analysis origin, no information about analysis origins is displayed on the alert page.

Note: Sometimes a code scanning alert displays as fixed for one analysis origin but is still open for a second analysis origin. You can resolve this by re-running the second code scanning configuration to update the alert status for that analysis origin.
About labels for alerts that are not found in application code
GitHub Enterprise Server assigns a category label to alerts that are not found in application code. The label relates to the location of the alert.
- Generated: Code generated by the build process
- Test: Test code
- Library: Library or third-party code
- Documentation: Documentation
Code scanning categorizes files by file path. You cannot manually categorize source files.
In this example, an alert is marked as in "Test" code in the code scanning alert list.

When you click through to see details for the alert, you can see that the file path is marked as "Test" code.
