Note: The security overview dashboard is currently in beta and subject to change.
About security insights
The overview page in security overview is a consolidated dashboard of insights about your organization or enterprise's security landscape and progress. You can use the dashboard to monitor the health of your application security program, collaborate with engineering teams, and gather data for benchmarking purposes.
Both the enterprise and organization-level security overviews have a dashboard. By default, the enterprise-level dashboard shows metrics for all the repositories in your enterprise. You can filter the data shown on the enterprise-level dashboard by owner (for example, by organization). By default, the organization-level dashboard shows metrics for all repositories owned by your organization. Both dashboards also allow you to filter by repository.
You can view a variety of metrics about the security alerts in your organization or enterprise. The dashboard displays trending data that tracks alert counts and activity over time, as well as snapshot data that reflects the current state.
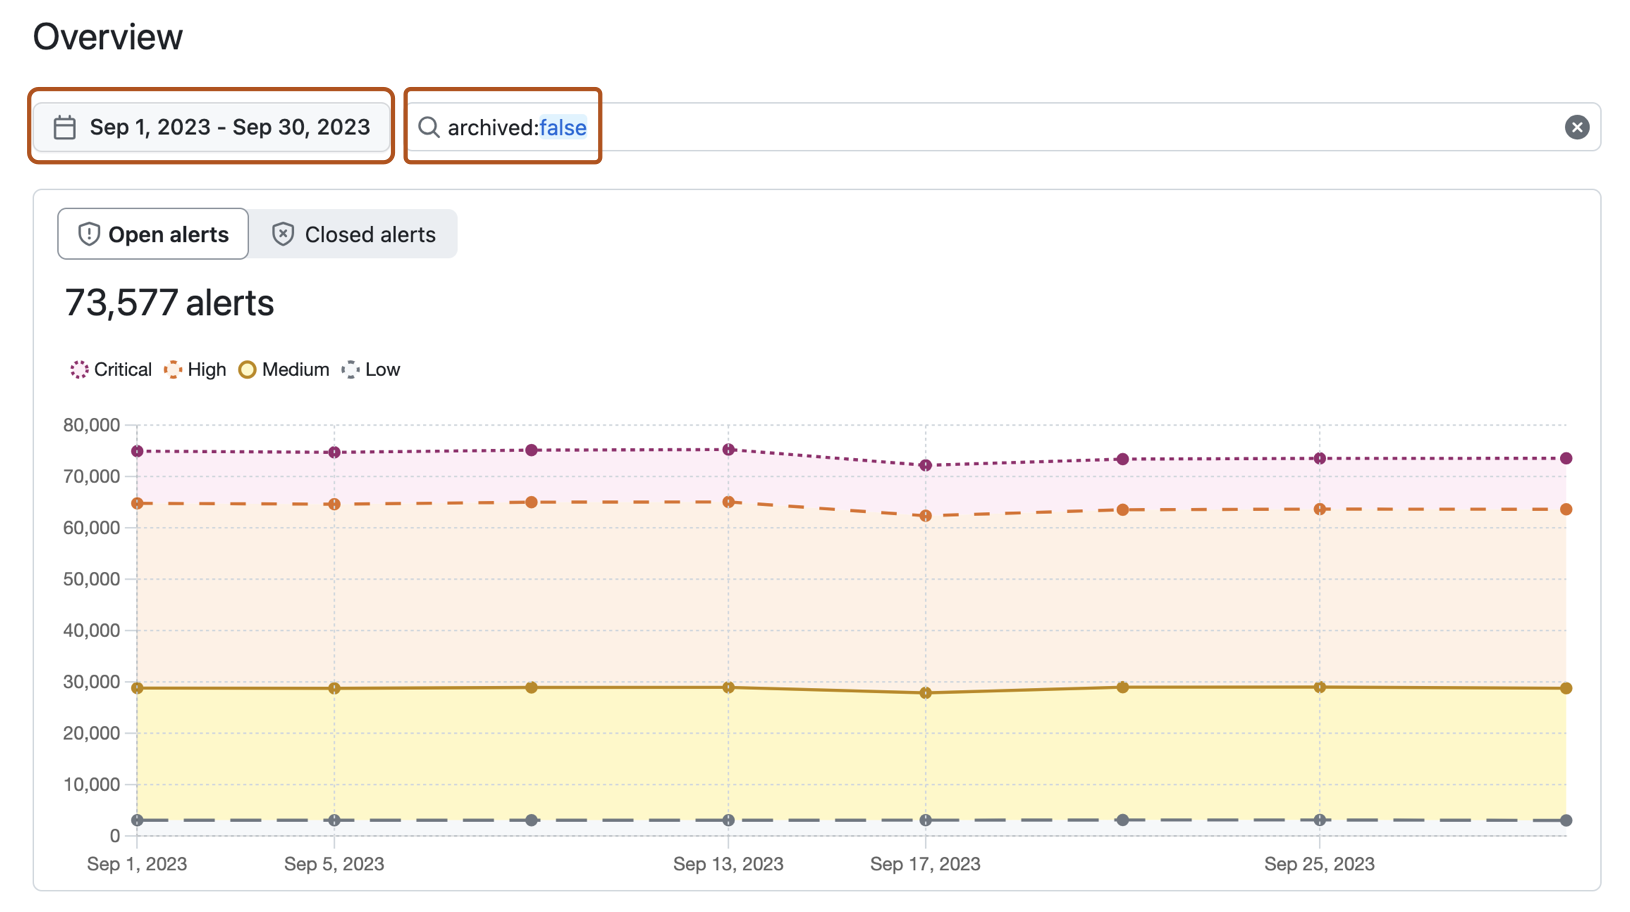
- The top section of the dashboard shows information about the status and age of alerts in your organization or enterprise, as well as data about secrets that have been blocked or bypassed.
- The "Remediation" section shows information about how alerts are resolved and alert activity over time.
- The "Impact analysis" section shows the repositories that pose the highest potential security risk in your organization or enterprise.
You can filter the overview dashboard by selecting a specific time period, and apply additional filters to focus on narrower areas of interest. All data and metrics across the dashboard will change as you apply filters. By default, the dashboard displays all alerts from GitHub tools, but you can use the tool filter to show alerts from a specific tool (secret scanning, Dependabot, code scanning using CodeQL, a specific third-party tool) or all third-party code scanning tools. This feature is in beta, and is subject to change. For more information, see "Filtering alerts in security overview."
Enterprise members can access the overview page for organizations in their enterprise. The metrics you see will depend on your role and repository permissions. For more information, see "About security overview."
Limitations
The data that populates the overview page can and will change over time due to various factors, such as repository deletion or modifications to a security advisory. This means that the overview metrics for the same time period could vary if viewed at two different times. For compliance reports or other scenarios where data consistency is crucial, we recommend that you source data from the audit log. For more information, see "Auditing security alerts."
Keep in mind that the overview page tracks changes over time for security alert data only. If you filter the page by non-alert attributes, such as repository status, the data you see will reflect the current state of those attributes, instead of the historical state. For example, consider that you archived a repository that contains open security alerts, an action which closes the alerts. If you then view the overview page for the week before you archived the repository, the alert data for the repository will only appear when you filter to show data from archived repositories, because the current state of the repository is archived. However, the alerts will appear as open, since they were open during that time period and the overview page tracks the historical state of alerts.
Note: The summary views ("Overview", "Coverage" and "Risk") show data only for high confidence alerts. Secret scanning alerts for ignored directories and non-provider alerts are all omitted from these views. Consequently, the individual alert views may include a larger number of open and closed alerts.
Viewing the security overview dashboard for your organization
-
On GitHub.com, navigate to the main page of the organization.
-
Under your organization name, click Security.

-
The overview page is the primary view that you will see after clicking on the "Security" tab. To get to the dashboard from another security overview page, in the sidebar, click Overview.
-
Use the options at the top of the overview page to filter the group of alerts you want to see metrics for. All of the data and metrics on the page will change as you adjust the filters.
- Use the date picker to set the time range that you want to view alert activity and metrics for.
- Click in the search box to add further filters on the alerts and metrics displayed.
-
For the alert trends graph at the top of the page, you can click Open alerts or Closed alerts to toggle between showing the trends for open or closed alerts. The toggle will only affect the alert trends graph. For more information, see "Alert trends graph."


Viewing the security overview dashboard for your enterprise
-
Navigate to GitHub.com.
-
In the top-right corner of GitHub.com, click your profile photo, then click Your enterprises.
-
In the list of enterprises, click the enterprise you want to view.
-
In the left sidebar, click Code Security.
-
Use the options at the top of the overview page to filter the group of alerts you want to see metrics for. All of the data and metrics on the page will change as you adjust the filters.
- Use the date picker to set the time range that you want to view alert activity and metrics for.
- Click in the search box to add further filters on the alerts and metrics displayed.
-
For the alert trends graph at the top of the page, you can click Open alerts or Closed alerts to toggle between showing the trends for open or closed alerts. The toggle will only affect the alert trends graph. For more information, see "Alert trends graph."
Understanding the overview dashboard
- Alert trends graph
- Age of alerts
- Secrets bypassed or blocked
- Mean time to remediate
- Net resolve rate
- Alert activity graph
- Impact analysis table
- Reopened alerts
Some metrics in the security overview dashboard include a trend indicator, which shows the percentage gain or loss for the chosen time period relative to previous period. For example, when you select a week with 10 alerts, if the previous week had 20 alerts, the trend indicator reports that the metric has dropped by 50%. If the average age of the open alerts is 15 days, and for the previous period it was 5 days, the trend indicator reports that the metric has risen by 200%. This feature is in beta, and is subject to change. This feature is in beta, and is subject to change.
Alert trends graph
The alert trends graph shows the change in the number of alerts in your organization or enterprise over the time period you have chosen. By default, alerts are grouped by severity. You can toggle the graph between open and closed alerts and change the way alerts are grouped.
Open alerts include both newly created and existing open security alerts. New alerts are represented on their creation date, while alerts that existed before the chosen time period are represented at the start of the period. Once an alert is remediated or dismissed, it is not included in the graph. Instead, the alert will move to the closed alerts graph.
Closed alerts include security alerts that have been successfully remediated or dismissed prior to or during the chosen time period. Alerts closed during the time period are represented on the graph on their closed date, while alerts remediated or dismissed before the chosen time period are represented at the start of the period.
Age of alerts
The "Age of alerts" metric is the average age of all alerts that are still open at the end of the chosen time period.
The age of each open alert is calculated by subtracting the date the alert was created from the date that the chosen time period ends. For reopened alerts, the age is calculated by subtracting the original created date rather than the date the alert was reopened.
Reopened alerts
Note: The "Reopened alerts" metric is in beta, and is subject to change.
The "Reopened alerts" metric is the total open alerts that were reopened during the chosen time period. Only alerts that are open at the end of the reporting period are reported. This includes:
- Alerts that were closed as of the day before the chosen time period, and that remain open at the end of the period.
- Newly created alerts that were closed, and then reopened, during the chosen time period.
- Alerts that were open at the start of the chosen time period, but closed and then reopened within the same period.
Secrets bypassed or blocked
The "Secrets bypassed / blocked" metric shows the ratio of secrets bypassed to the total secrets blocked by push protection.
You can also see how many secrets were successfully blocked, which is calculated by subtracting the number of secrets bypassed from the total number of secrets blocked by push protection. A secret is considered to have been successfully blocked when it has been corrected, and not committed to the repository.
You can click View details to view the secret scanning report with the same filters and time period selected. This feature is in beta, and is subject to change.
For more information on secret scanning push protection metrics, see "Viewing metrics for secret scanning push protection in your organization."
Mean time to remediate
The "Mean time to remediate" metric is the average age of all alerts that were remediated or dismissed in the chosen time period. Alerts that were closed as "false positive" are excluded.
The age of each closed alert is calculated by subtracting the date the alert was created from the date that the alert was last closed during the chosen time period. For reopened alerts, the age is calculated by subtracting the original created date rather than the date the alert was reopened.
Net resolve rate
The "Net resolve rate" metric is the rate at which alerts are being closed. This metric is similar to measuring "developer velocity", reflecting the speed and efficiency with which alerts are resolved.
The rate is calculated by dividing the number of alerts that were closed and remained closed during the chosen time period, by the number of alerts created during the time period.
Note: The net resolve rate takes into account any new and any closed alerts during the chosen time period. This means that the set of new alerts and set of closed alerts used for the calculation do not necessarily correspond, since they may represent different populations of alerts.
Alerts that are reopened and re-closed during the chosen time period are ignored.
Autofix suggestions
Note: GitHub autofix for code scanning is in beta. Functionality and documentation are subject to change. During this phase, the feature is restricted to JavaScript, TypeScript, Python, and Java alerts identified by CodeQL. If you have an enterprise account and use GitHub Advanced Security, your enterprise has access to the beta.
Autofix, powered by GitHub Copilot, is an expansion of code scanning that provides you with targeted recommendations to help you fix code scanning alerts in pull requests. For more information, see "About autofix for CodeQL code scanning."
The "Autofix suggestions" metric is the total number of Autofix suggestions generated in open and closed pull requests during the chosen time period.
Alert activity graph
Expanding on the alert trends graph, the alert activity graph shows you alert inflows and outflows over your chosen time period.
Green bars represent the number of new alerts created during the segmented time period. Purple bars represent the number of alerts that were closed during the segmented time period. The blue dotted line represents the net alert activity, which is the difference between new and closed alerts.
Impact analysis table
Note: The "Impact analysis" table is in beta, and is subject to change.
The impact analysis table has separate tabs showing data for: "Repositories" and "Advisories".
-
The "Repositories" tab shows the top 10 repositories with the most open alerts at the end of the chosen time period, ranked by the total number of open alerts. For each repository, the total number of open alerts is shown alongside a breakdown by severity.
-
The "Advisories" tab shows the 10 CVE advisories that triggered the most Dependabot alerts at the end of the chosen time period, ranked by the total number of open alerts. For each advisory, the total number of open alerts is shown alongside a severity rating.