GitHub Enterprise provides SNMP, or Simple Network Management Protocol, data for monitoring purposes. SNMP is a common standard for monitoring devices over a network. You can pull data regarding disk usage, CPU utilization, memory usage, etc. GitHub Enterprise has a standard SNMP installation, so you can take advantage of the many plugins available for Nagios or for any other monitoring system of your choice.
Only hardware-level information is returned via SNMP; the applications and services within GitHub Enterprise do not have a configured OID to report metrics. It would be reasonable to monitor memory and disk usage located in HOST-RESOURCES-MIB ( .1.3.6.1.2.1.25 ). Note that we exclude the hrSWRun tree ( .1.3.6.1.2.1.25.4 ) to prevent leaking information about services running on the appliance.
Enabling SNMP
By default, SNMP is disabled. You can enable it on the Management Console settings page available at http(s)://[hostname]/setup/settings.
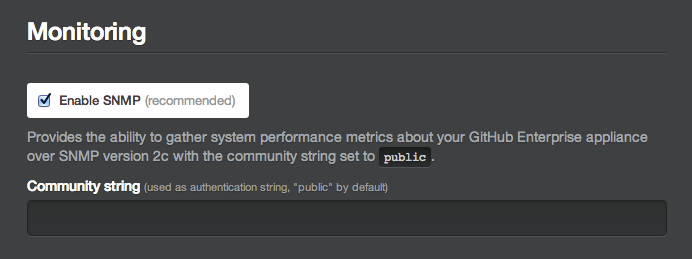
GitHub Enterprise supports version 2c of the SNMP protocol with the community string is left at its default "public" setting. Once you've enabled SNMP, save your settings.
Testing SNMP
You can test SNMP to make sure it's working after you've saved your settings by running the following command (where [hostname] is the IP or domain of your installation):
snmpget -v 2c -c public -O e [hostname] hrSystemDate.0
The output it returns should contain the system time on your installation. You can view all the information that's available by performing an SNMP walk:
snmpwalk -v 2c -c public -O e [hostname]
You can find some additional information about OID mappings to common system attributes in SNMP here.