-
在 GitHub 上,导航到存储库的主页面。
-
在存储库名称下,单击 “操作”。

-
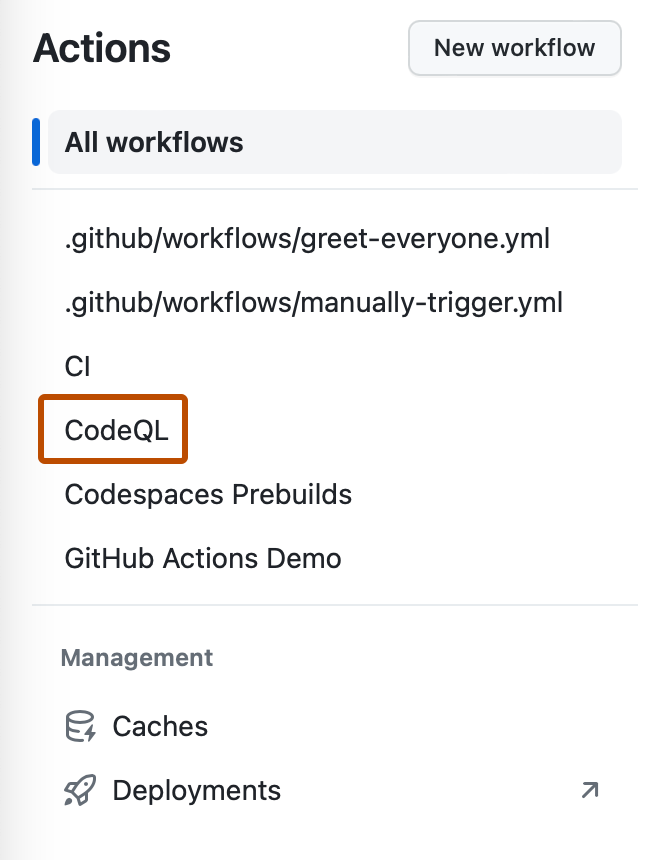
在左侧边栏中,单击您想要查看的工作流程。
-
在工作流运行列表中,单击运行的名称以查看工作流运行摘要。
-
图表显示每个工作流程中的作业。 作业名称左侧的图标指示作业的状态。 作业之间的线表示依赖项。

-
要查看作业的日志,请单击该作业。
使用可视化图表
每个工作流程运行都会生成一个实时图表,说明运行进度。 您可以使用此图表来监控和调试工作流程。
每个工作流程运行都会生成一个实时图表,说明运行进度。 您可以使用此图表来监控和调试工作流程。
在 GitHub 上,导航到存储库的主页面。
在存储库名称下,单击 “操作”。

在左侧边栏中,单击您想要查看的工作流程。

在工作流运行列表中,单击运行的名称以查看工作流运行摘要。
图表显示每个工作流程中的作业。 作业名称左侧的图标指示作业的状态。 作业之间的线表示依赖项。

要查看作业的日志,请单击该作业。