-
GitHub에서 리포지토리의 기본 페이지로 이동합니다.
-
리포지토리 이름 아래에서 작업을 클릭합니다.

-
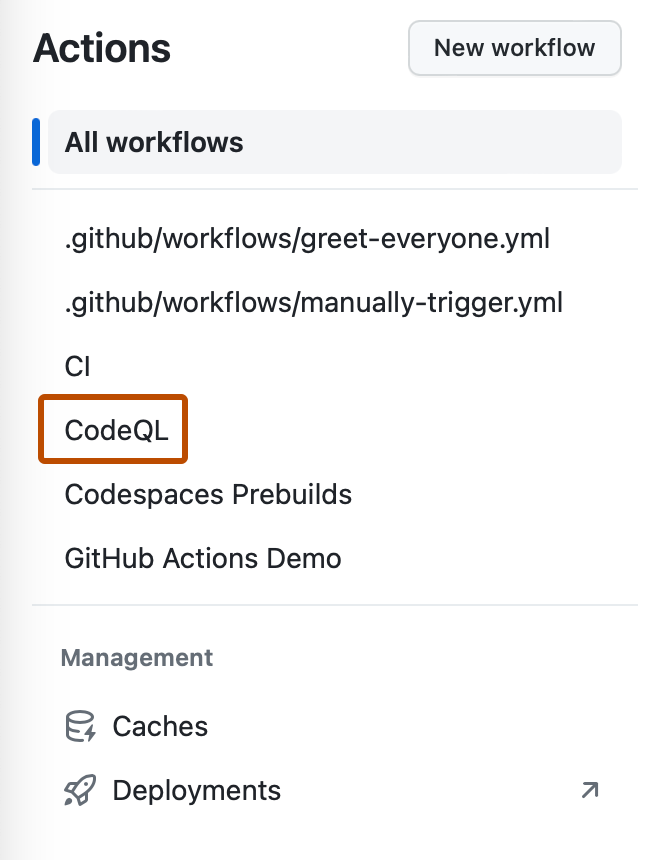
왼쪽 사이드바에서 확인할 워크플로를 클릭합니다.
-
워크플로 실행 목록에서 실행 이름을 클릭하여 워크플로 실행 요약을 확인합니다.
-
그래프는 워크플로의 각 작업을 표시합니다. 작업 이름 왼쪽에 있는 아이콘은 작업의 상태를 나타냅니다. 작업 사이의 줄은 종속성을 나타냅니다.

-
작업 로그를 보려면 작업을 클릭합니다.
시각화 그래프 사용
모든 워크플로 실행은 실행 진행률을 보여주는 실시간 그래프를 생성합니다. 이 그래프를 사용하여 워크플로를 모니터링하고 디버그할 수 있습니다.


