Using the visualization graph

Every workflow run generates a real-time graph that illustrates the run progress. You can use this graph to monitor and debug workflows.

  1. GitHub.com에서 리포지토리의 기본 페이지로 이동합니다.

  2. 리포지토리 이름 아래에서 작업을 클릭합니다.

    "github/docs" 리포지토리의 탭 스크린샷. "작업" 탭은 주황색 윤곽선으로 강조 표시됩니다.

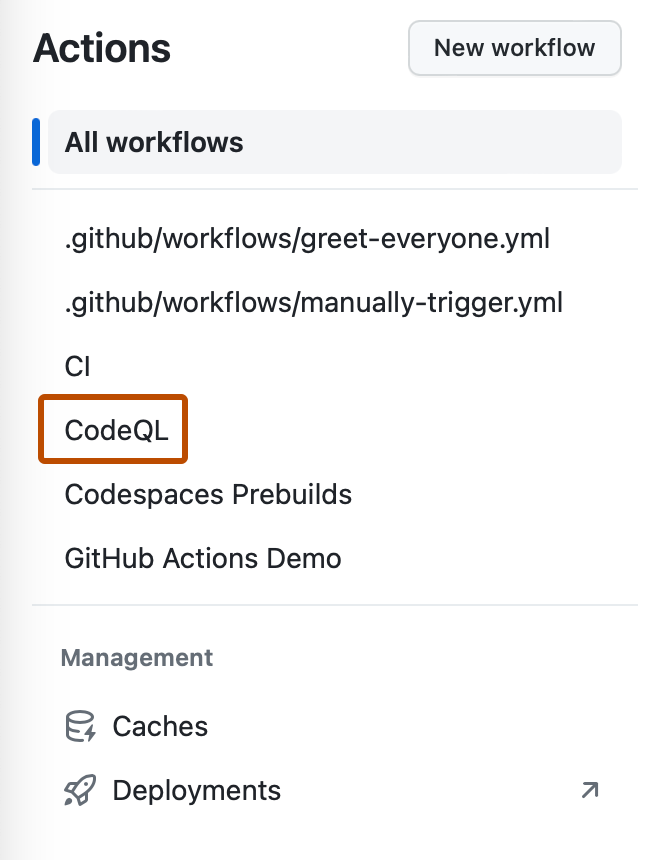
  3. 왼쪽 사이드바에서 확인할 워크플로를 클릭합니다.

    "작업" 탭의 왼쪽 사이드바 스크린샷. "CodeQL"이라는 워크플로가 진한 주황색 윤곽선으로 표시되어 있습니다.

  4. 워크플로 실행 목록에서 실행 이름을 클릭하여 워크플로 실행 요약을 확인합니다.

  5. The graph displays each job in the workflow. An icon to the left of the job name indicates the status of the job. Lines between jobs indicate dependencies.

    Screenshot of the visualization graph of a workflow run.

  6. To view a job's log, click the job.