SNMP is a common standard for monitoring devices over a network. GitHub Enterprise provides data on disk usage, CPU utilization, memory usage, and more over SNMP. We strongly recommend enabling SNMP so you can monitor the health of your GitHub Enterprise instance and know when to add more memory, storage, or processor power to the host machine.
GitHub Enterprise has a standard SNMP installation, so you can take advantage of the many plugins available for Nagios or for any other monitoring system of your choice.
Configuring SNMP v2c
In the upper-right corner of any page, click .

In the left sidebar, click Management Console.
In the left sidebar, click Monitoring.
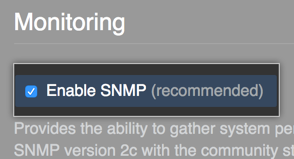
Under "Monitoring", select Enable SNMP.
In the Community string field, enter a new community string. If left blank, this defaults to
public.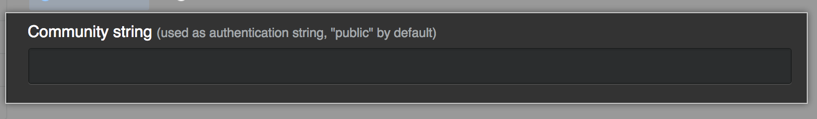
At the bottom of the Management Console configuration page, click Save settings.

-
Test your SNMP configuration by running the following command on a separate workstation with SNMP support in your network:
# community-string is your community string
# hostname is the IP or domain of your Enterprise instance
snmpget -v 2c -c community-string -O e hostname hrSystemDate.0
This should return the system time on your GitHub Enterprise instance host.
Querying SNMP data
With SNMP v2c, only hardware-level information about your appliance is available. The applications and services within GitHub Enterprise do not have OIDs configured to report metrics. Several MIBs are available, which you can see by running snmpwalk on a separate workstation with SNMP support in your network:
# community-string is your community string
# hostname is the IP or domain of your Enterprise instance
snmpwalk -v 2c -c community-string -O e hostname
Of the available MIBs for SNMP, the most useful is HOST-RESOURCES-MIB (.1.3.6.1.2.1.25). See the table below for some important objects in this MIB:
| Name | OID | Description |
|---|---|---|
| hrSystemDate.2 | .1.3.6.1.2.1.25.1.2 | The hosts notion of the local date and time of day. |
| hrSystemUptime.0 | .1.3.6.1.2.1.25.1.1.0 | How long it's been since the host was last initialized. |
| hrMemorySize.0 | .1.3.6.1.2.1.25.2.2.0 | The amount of RAM on the host. |
| hrSystemProcesses.0 | .1.3.6.1.2.1.25.1.6.0 | The number of process contexts currently loaded or running on the host. |
| hrStorageUsed.1 | .1.3.6.1.2.1.25.2.3.1.6.1 | The amount of storage space consumed on the host, in hrStorageAllocationUnits. |
| hrStorageAllocationUnits.1 | .1.3.6.1.2.1.25.2.3.1.4.1 | The size, in bytes, of an hrStorageAllocationUnit |
With SNMP v2c, to query for hrMemorySize, run the following command on a separate workstation with SNMP support in your network:
# community-string is your community string
# hostname is the IP or domain of your Enterprise instance
snmpget -v 2c -c community-string hostname HOST-RESOURCES-MIB::hrMemorySize.0
Note: To prevent leaking information about services running on your appliance, we exclude the hrSWRun table (1.1.3.6.1.2.1.25.41) from the resulting SNMP reports.
For more information on OID mappings for common system attributes in SNMP, see "Linux SNMP OIDs".