You can see all commits made to a repository in the past year (excluding merge commits) in the Commit graph.
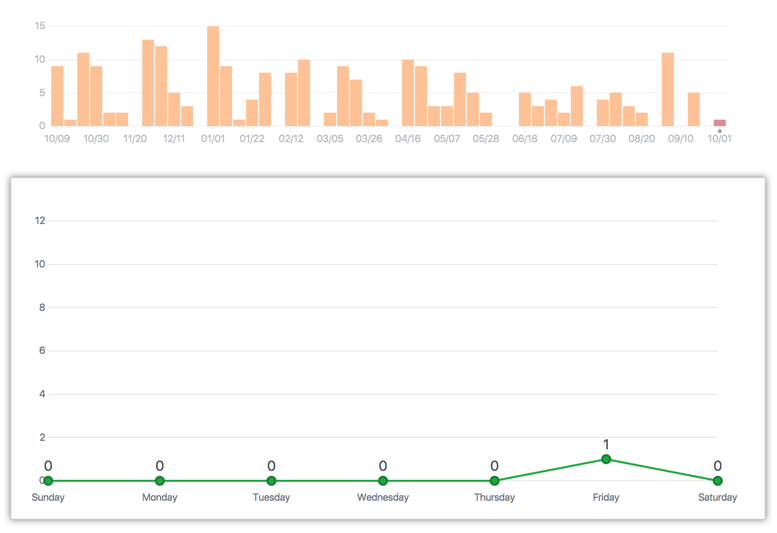
The top graph shows commits for the entire year by week.
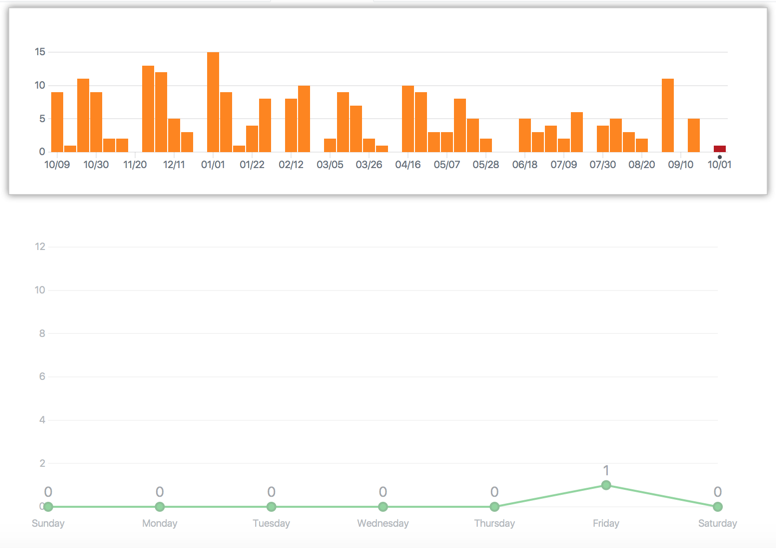
The bottom graph shows the average number of commits by day of the week for the selected week.
Accessing the Commits graph
On GitHub Enterprise, navigate to the main page of the repository.
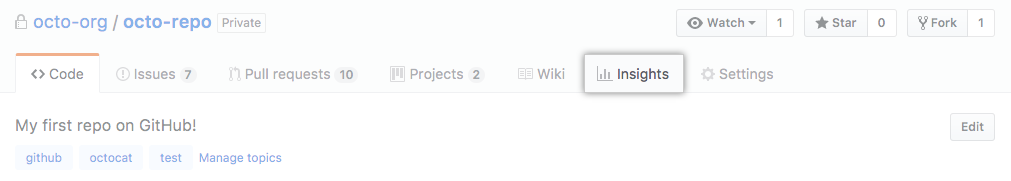
- Under your repository name, click Insights.
- In the left sidebar, click Commits.