Every repository has graphs that display data about contributors, commits, and traffic.
Accessing repository graphs
To see graphs for a repository, navigate to the repository and click the Graphs tab on the right side of the page.
Contributors
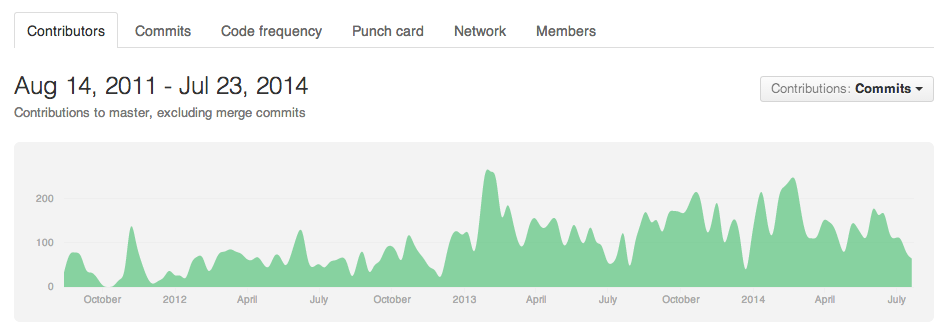
The Contributors graph shows commits made by the top 100 contributors over the lifetime of your project.
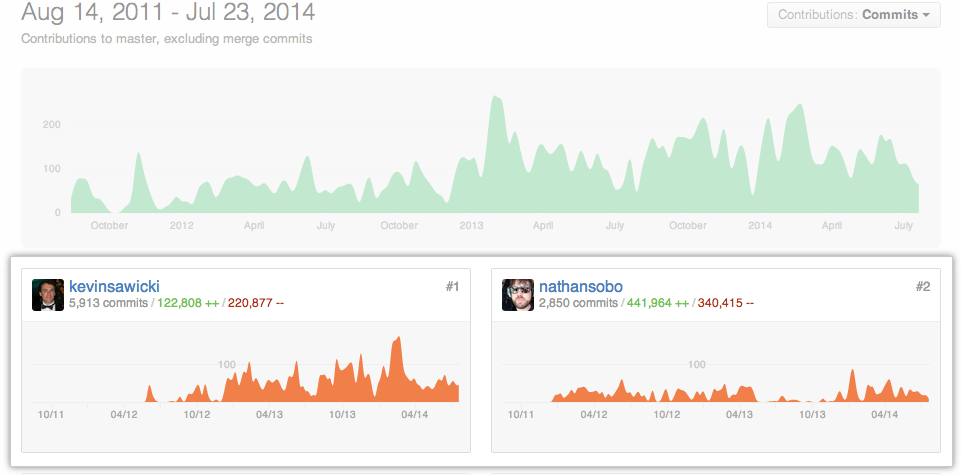
Below the main graph, we display specific graphs for each contributor.
You can click and drag in the main graph to select a range of time over which to view contributors and commits.

If you've contributed to a project, but don't see yourself in the repository contributors graph, see "I don't see myself in the repository contributors graph" for troubleshooting help.
Commits
The Commit Activity graph shows all commits made to your repository over the past year.
The top graph shows commits for the entire year by week.
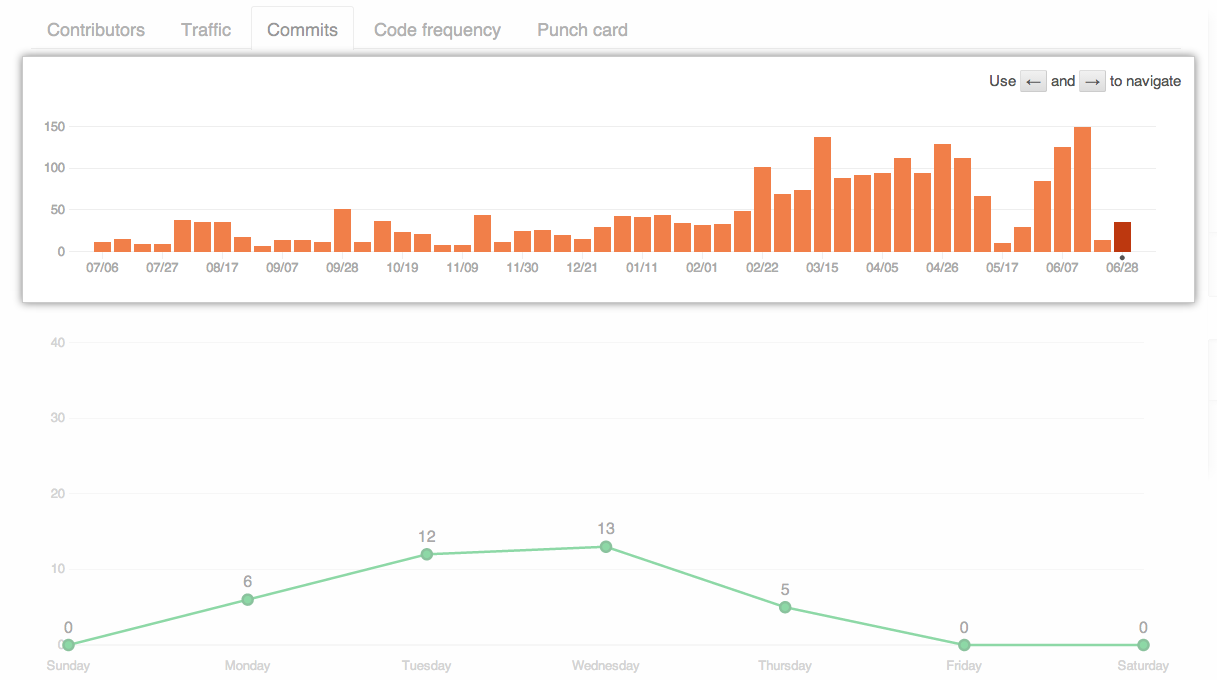
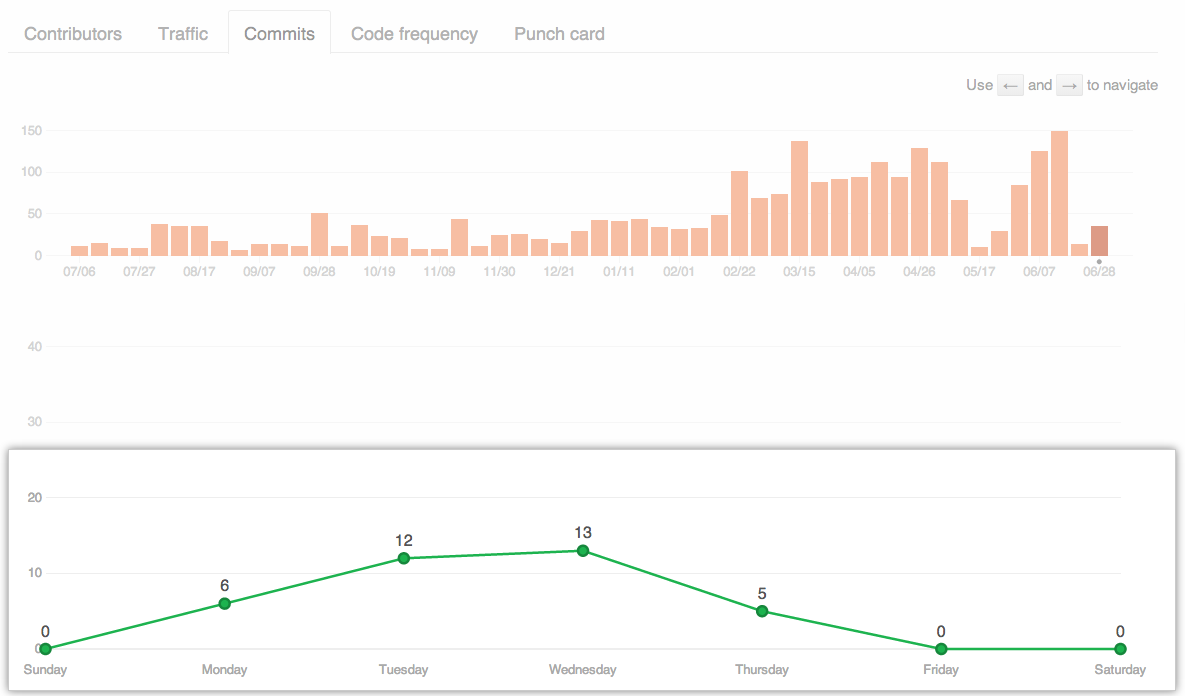
The bottom graph shows the average number of commits by day of the week for the selected week.
Code frequency
The Code frequency graph uses the same information as the Commit activity graph, but shows the number of additions and deletions in the repository, rather than the total number of commits.
Punch card
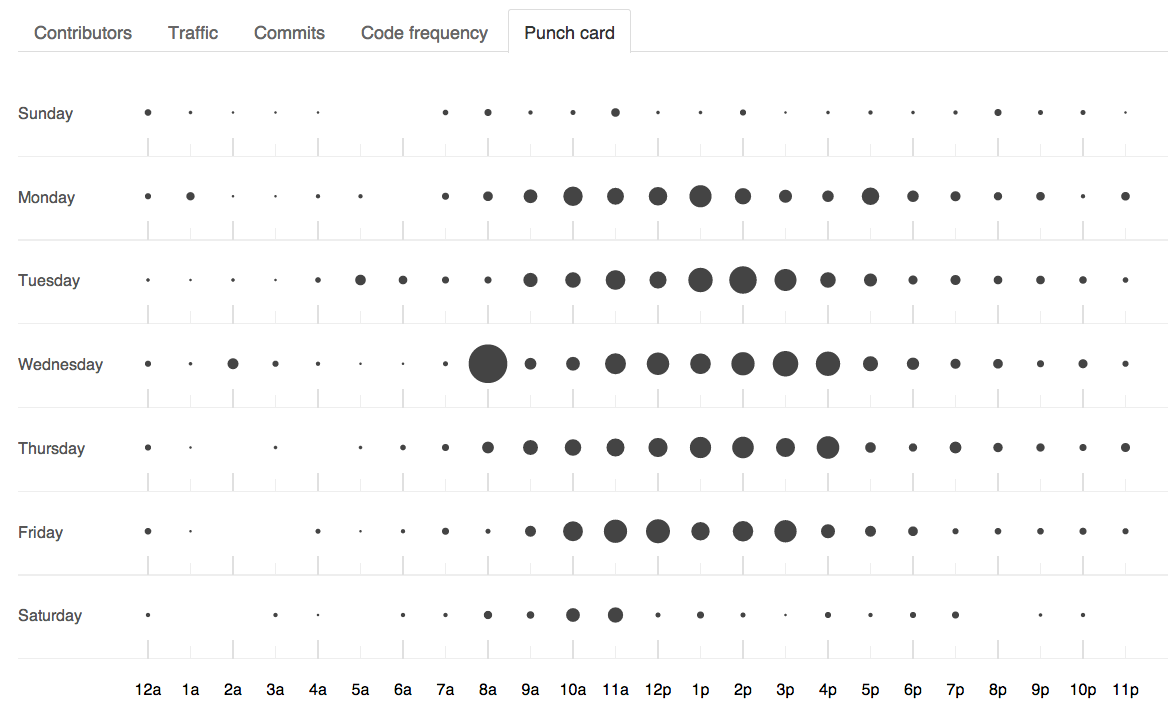
The Punch card graph shows the frequency of updates to your repository based on day of week and time of day. The size of the black circle indicates commit frequency.
Network
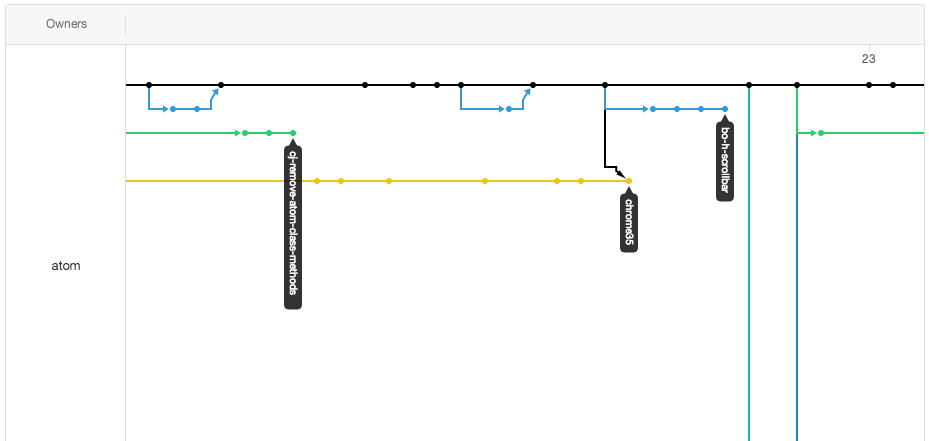
The Network graph shows the branch history for the default branch of the repository. To see older branches, click and drag in the graph.
Members
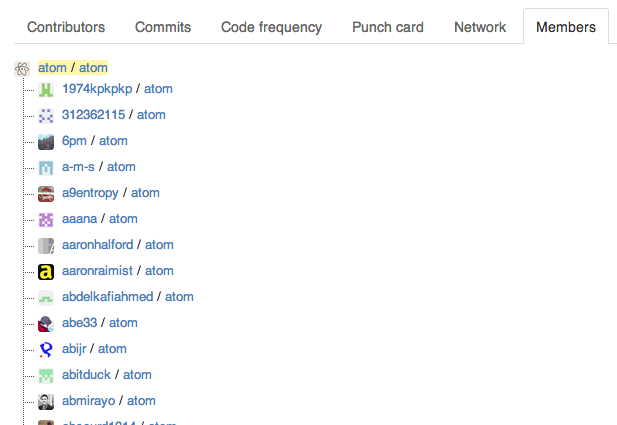
The Members tab shows all forks of the repository.
