Viewing the alerts for a repository
Anyone with read permission for a repository can see code scanning annotations on pull requests. For more information, see "Triaging code scanning alerts in pull requests."
You need write permission to view a summary of all the alerts for a repository on the Security tab.
By default, the code scanning alerts page is filtered to show alerts for the default branch of the repository only.
-
On GitHub.com, navigate to the main page of the repository.
-
Under the repository name, click Security. If you cannot see the "Security" tab, select the dropdown menu, and then click Security.

-
In the left sidebar, click Code scanning.
-
Optionally, use the free text search box or the dropdown menus to filter alerts. For example, you can filter by the tool that was used to identify alerts.

-
Under "Code scanning," click the alert you'd like to explore to display the detailed alert page. The status and details on the alert page only reflect the state of the alert on the default branch of the repository, even if the alert exists in other branches. You can see the status of the alert on non-default branches in the Affected branches section on the right-hand side of the alert page. If an alert doesn't exist in the default branch, the status of the alert will display as "in pull request" or "in branch" and will be colored grey.
-
Optionally, if the alert highlights a problem with data flow, click Show paths to display the path from the data source to the sink where it's used.

-
Alerts from CodeQL analysis include a description of the problem. Click Show more for guidance on how to fix your code.


For more information, see "About code scanning alerts."
Note: You can see information about when code scanning analysis last ran on the tool status page. For more information, see "About the tool status page for code scanning."
Filtering code scanning alerts
You can filter the alerts shown in the code scanning alerts view. This is useful if there are many alerts as you can focus on a particular type of alert. There are some predefined filters and a range of keywords that you can use to refine the list of alerts displayed.
When you select a keyword from either a drop-down list, or as you enter a keyword in the search field, only values with results are shown. This makes it easier to avoid setting filters that find no results.

If you enter multiple filters, the view will show alerts matching all these filters. For example, is:closed severity:high branch:main will only display closed high-severity alerts that are present on the main branch. The exception is filters relating to refs (ref, branch and pr): is:open branch:main branch:next will show you open alerts from both the main branch and the next branch.
Please note that if you have filtered for alerts on a non-default branch, but the same alerts exist on the default branch, the alert page for any given alert will still only reflect the alert's status on the default branch, even if that status conflicts with the status on a non-default branch. For example, an alert that appears in the "Open" list in the summary of alerts for branch-x could show a status of "Fixed" on the alert page, if the alert is already fixed on the default branch. You can view the status of the alert for the branch you filtered on in the Affected branches section on the right side of the alert page.
You can prefix the tag filter with - to exclude results with that tag. For example, -tag:style only shows alerts that do not have the style tag.
Restricting results to application code only
You can use the "Only alerts in application code" filter or autofilter:true keyword and value to restrict results to alerts in application code. For more information about the types of code that are automatically labeled as not application code, see "About code scanning alerts."
Searching code scanning alerts
You can search the list of alerts. This is useful if there is a large number of alerts in your repository, or if you don't know the exact name for an alert for example. GitHub Enterprise Cloud performs the free text search across:
- The name of the alert
- The alert details (this also includes the information hidden from view by default in the Show more collapsible section)
| Supported search | Syntax example | Results |
|---|---|---|
| Single word search | injection | Returns all the alerts containing the word injection |
| Multiple word search | sql injection | Returns all the alerts containing sql or injection |
| Exact match search (use double quotes) | "sql injection" | Returns all the alerts containing the exact phrase sql injection |
| OR search | sql OR injection | Returns all the alerts containing sql or injection |
| AND search | sql AND injection | Returns all the alerts containing both words sql and injection |
Tips:
- The multiple word search is equivalent to an OR search.
- The AND search will return results where the search terms are found anywhere, in any order in the alert name or details.
- On GitHub.com, navigate to the main page of the repository.
- Under the repository name, click Security. If you cannot see the "Security" tab, select the dropdown menu, and then click Security.
- In the left sidebar, click Code scanning.
- To the right of the Filters drop-down menus, type the keywords to search for in the free text search box.

- Press return. The alert listing will contain the open code scanning alerts matching your search criteria.

Tracking code scanning alerts in issues
Note: The tracking of code scanning alerts in issues is in beta and subject to change.
This feature supports running analysis natively using GitHub Actions or externally using existing CI/CD infrastructure, as well as third-party code scanning tools, but not third-party tracking tools.
To quickly create an issue to track the status of a specific code scanning alert, on the code scanning alerts page, click the alert you would like to track. On the detailed page for that alert, click Create issue. Customize the autogenerated issue as desired, then click Submit new issue.
Alternatively, to track a code scanning alert in an existing issue, add the URL for the alert as a task list item in the issue. For more information about task lists, see "About task lists."
For more information about creating issues to track code scanning alerts, see "Tracking code scanning alerts in issues using task lists."
Fixing an alert
Anyone with write permission for a repository can fix an alert by committing a correction to the code. If the repository has code scanning scheduled to run on pull requests, it's best to raise a pull request with your correction. This will trigger code scanning analysis of the changes and test that your fix doesn't introduce any new problems. For more information, see "Customizing your advanced setup for code scanning" and "Triaging code scanning alerts in pull requests."
If you have write permission for a repository, you can view fixed alerts by viewing the summary of alerts and clicking Closed. For more information, see "Viewing the alerts for a repository." The "Closed" list shows fixed alerts and alerts that users have dismissed.
You can use the free text search or the filters to display a subset of alerts and then in turn mark all matching alerts as closed.
Alerts may be fixed in one branch but not in another. You can use the "Branch" filter, on the summary of alerts, to check whether an alert is fixed in a particular branch.

Please note that if you have filtered for alerts on a non-default branch, but the same alerts exist on the default branch, the alert page for any given alert will still only reflect the alert's status on the default branch, even if that status conflicts with the status on a non-default branch. For example, an alert that appears in the "Open" list in the summary of alerts for branch-x could show a status of "Fixed" on the alert page, if the alert is already fixed on the default branch. You can view the status of the alert for the branch you filtered on in the Affected branches section on the right side of the alert page.
Note: If you run code scanning using multiple configurations, the same alert will sometimes be generated by more than one configuration. Unless you run all configurations regularly, you may see alerts that are fixed in one configuration but not in another. These stale configurations and alerts can be removed from a branch. For more information, see "Removing stale configurations and alerts from a branch."
Dismissing alerts
There are two ways of closing an alert. You can fix the problem in the code, or you can dismiss the alert.
Dismissing an alert is a way of closing an alert that you don't think needs to be fixed. For example, an error in code that's used only for testing, or when the effort of fixing the error is greater than the potential benefit of improving the code. You can dismiss alerts from code scanning annotations in code, or from the summary list within the Security tab.
When you dismiss an alert:
- It's dismissed in all branches.
- The alert is removed from the number of current alerts for your project.
- The alert is moved to the "Closed" list in the summary of alerts, from where you can reopen it, if required.
- The reason why you closed the alert is recorded.
- Optionally, you can comment on a dismissal to record the context of an alert dismissal.
- Next time code scanning runs, the same code won't generate an alert.
To dismiss alerts:
-
On GitHub.com, navigate to the main page of the repository.
-
Under the repository name, click Security. If you cannot see the "Security" tab, select the dropdown menu, and then click Security.
-
In the left sidebar, click Code scanning.
-
If you want to dismiss an alert, it's important to explore the alert first, so that you can choose the correct dismissal reason. Click the alert you'd like to explore.
-
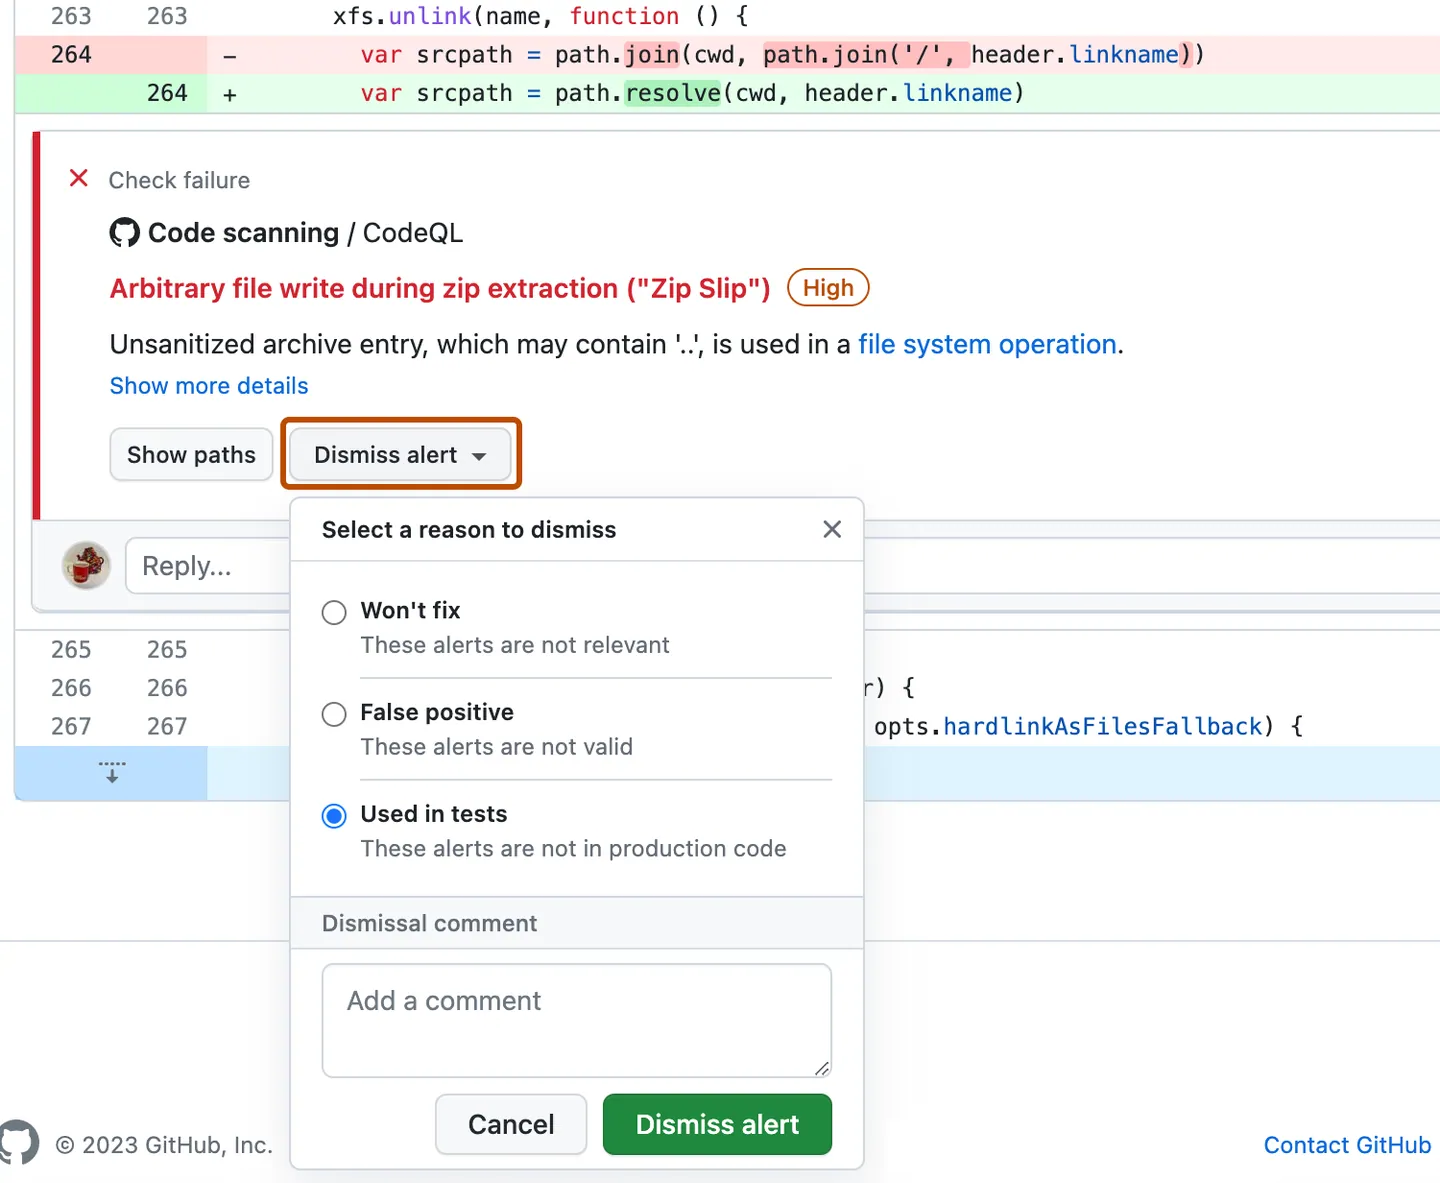
Review the alert, then click Dismiss alert and choose, or type, a reason for closing the alert.
It's important to choose the appropriate reason from the drop-down menu as this may affect whether a query continues to be included in future analysis. Optionally, you can comment on a dismissal to record the context of an alert dismissal. The dismissal comment is added to the alert timeline and can be used as justification during auditing and reporting. You can retrieve or set a comment by using the code scanning REST API. The comment is contained in
dismissed_commentfor thealerts/{alert_number}endpoint. For more information, see "REST API endpoints for code scanning."If you dismiss a CodeQL alert as a false positive result, for example because the code uses a sanitization library that isn't supported, consider contributing to the CodeQL repository and improving the analysis. For more information about CodeQL, see "Contributing to CodeQL."
Dismissing multiple alerts at once
If a project has multiple alerts that you want to dismiss for the same reason, you can bulk dismiss them from the summary of alerts. Typically, you'll want to filter the list and then dismiss all of the matching alerts. For example, you might want to dismiss all of the current alerts in the project that have been tagged for a particular Common Weakness Enumeration (CWE) vulnerability.
Re-opening dismissed alerts
If you dismiss an alert but later realize that you need to fix the alert, you can re-open it and fix the problem with the code. Display the list of closed alerts, find the alert, display it, and reopen it. You can then fix the alert in the same way as any other alert.
Removing stale configurations and alerts from a branch
You may have multiple code scanning configurations on a single repository. When run, multiple configurations can generate the same alert. Additionally, if the configurations are run on different schedules, the alert statuses may become out-of-date for infrequent or stale configurations. For more information on alerts from multiple configurations, see "About code scanning alerts."
-
On GitHub.com, navigate to the main page of the repository.
-
Under the repository name, click Security. If you cannot see the "Security" tab, select the dropdown menu, and then click Security.
-
In the left sidebar, click Code scanning.
-
Under "Code scanning", click a code scanning alert.
-
In the "Affected branches" section of the sidebar, click the desired branch.
-
In the "Configurations analyzing" dialog, review details of the configurations that reported this alert on the selected branch. To delete an unwanted configuration for the desired branch, click .
If you delete a configuration by mistake, click Cancel to avoid applying your changes.

-
Once you have removed any unwanted configurations and confirmed the expected configurations are displayed, click Save changes.
If you save your changes after accidentally deleting a configuration, re-run the configuration to update the alert. For more information on re-running configurations that use GitHub Actions, see "Re-running workflows and jobs."

Notes:
- If you remove all code scanning configurations for the default branch of your repository, the default branch will remain in the "Affected branches" sidebar, but it will not be analyzed by any configurations.
- If you remove all code scanning configurations for any branch other than the default branch of your repository, that branch will be removed from the "Affected branches" sidebar.
Auditing responses to code scanning alerts
You can audit the actions taken in response to code scanning alerts using GitHub tools. For more information, see "Auditing security alerts."