Enterprise Server 3.15 is currently available as a release candidate.

Using the visualization graph

Every workflow run generates a real-time graph that illustrates the run progress. You can use this graph to monitor and debug workflows.

Note

GitHub-hosted runners are not currently supported on GitHub Enterprise Server. You can see more information about planned future support on the GitHub public roadmap.

  1. On GitHub, navigate to the main page of the repository.

  2. Under your repository name, click Actions.

    Screenshot of the tabs for the "github/docs" repository. The "Actions" tab is highlighted with an orange outline.

  3. In the left sidebar, click the workflow you want to see.
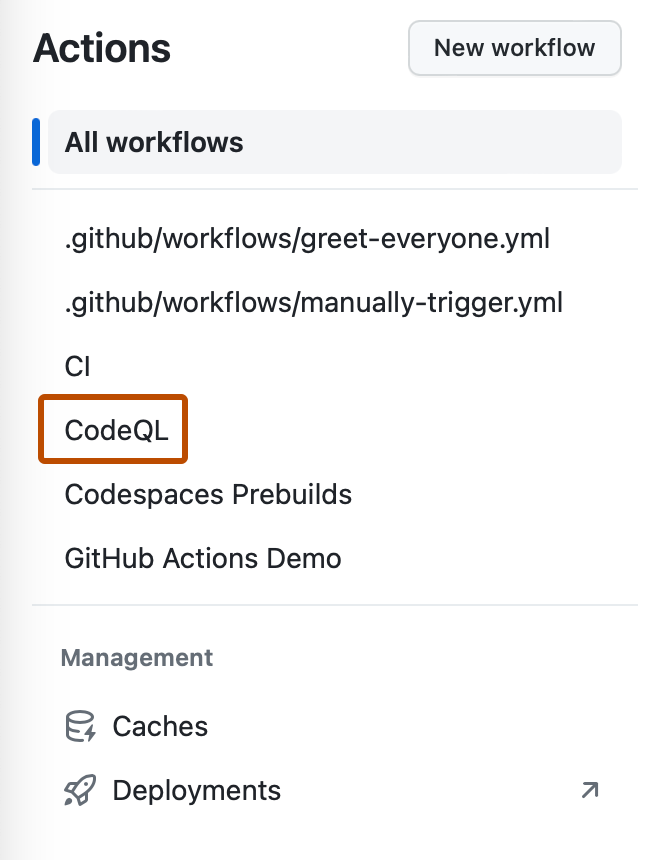
    Screenshot of the left sidebar of the "Actions" tab. A workflow, "CodeQL," is outlined in dark orange.

  4. From the list of workflow runs, click the name of the run to see the workflow run summary.

  5. The graph displays each job in the workflow. An icon to the left of the job name indicates the status of the job. Lines between jobs indicate dependencies.

    Screenshot of the visualization graph of a workflow run.

  6. To view a job's log, click the job.