About the discussions insights dashboard
You can use discussions insights to help understand the contribution activity, page views, and growth of your discussions community.
- Contribution activity shows the count of total contributions to discussions, issues, and pull requests.
- Discussions page views shows the total page views for discussions, segmented by logged in versus anonymous viewers.
- Discussions daily contributors shows the daily count of unique users who have reacted, upvoted, marked an answer, commented, or posted in the selected time period.
- Discussions new contributors shows the daily count of unique new users who have reacted, upvoted, marked an answer, commented, or posted in the selected time period.

Note: To view the exact data for a time period, hover over that time period in the graph.
Viewing discussions insights
-
On your GitHub Enterprise Server instance, navigate to the main page of the repository. For organization discussions, navigate to the main page of the source repository.
-
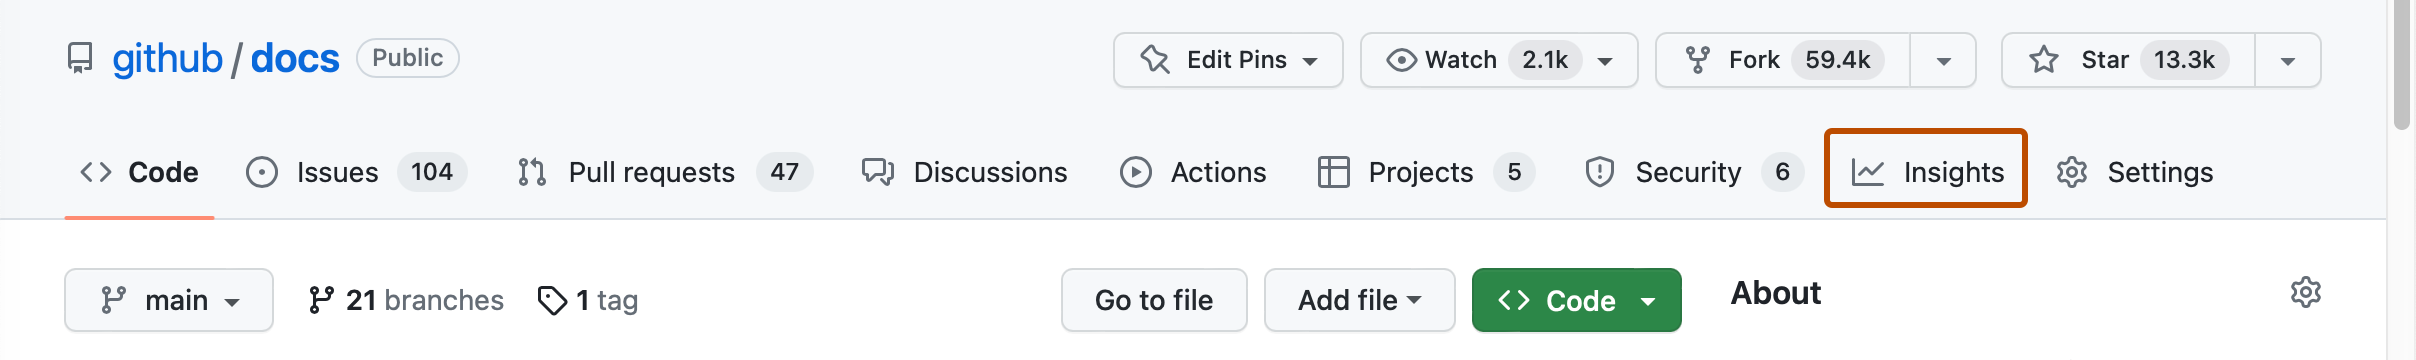
Under your repository name, click Insights.
-
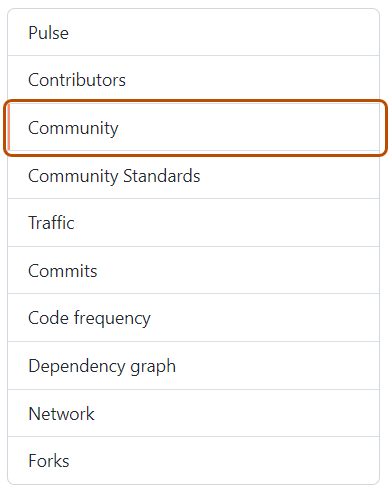
In the left sidebar, click Community.
-
Optionally, in the upper-right corner of the page, select the Period dropdown menu and click the time period for which you want to view data: 30 days, 3 months, or 1 year.

