# Working with non-code files
GitHub supports rendering and diffing in a number of non-code file formats.
## Rendering and diffing images
GitHub can display several common image formats, including PNG, JPG, GIF, PSD, and SVG. In addition to simply displaying them, there are several ways to compare differences between versions of those image formats.
> \[!NOTE]
>
> * GitHub does not support comparing the differences between PSD files.
> * If you are using the Firefox browser, SVGs on GitHub may not render.
### Viewing images
You can directly browse and view images in your repository on GitHub.
SVGs don't currently support inline scripting or animation.
### Viewing differences
You can visually compare images in three different modes: [2-up](#2-up), [swipe](#swipe), and [onion skin](#onion-skin).
#### 2-up
**2-up** is the default mode; it gives you a quick glimpse of both images. In addition, if the image has changed size between versions, the actual dimension change is displayed. This should make it very apparent when things are resized, such as when assets are upgraded to higher resolutions.

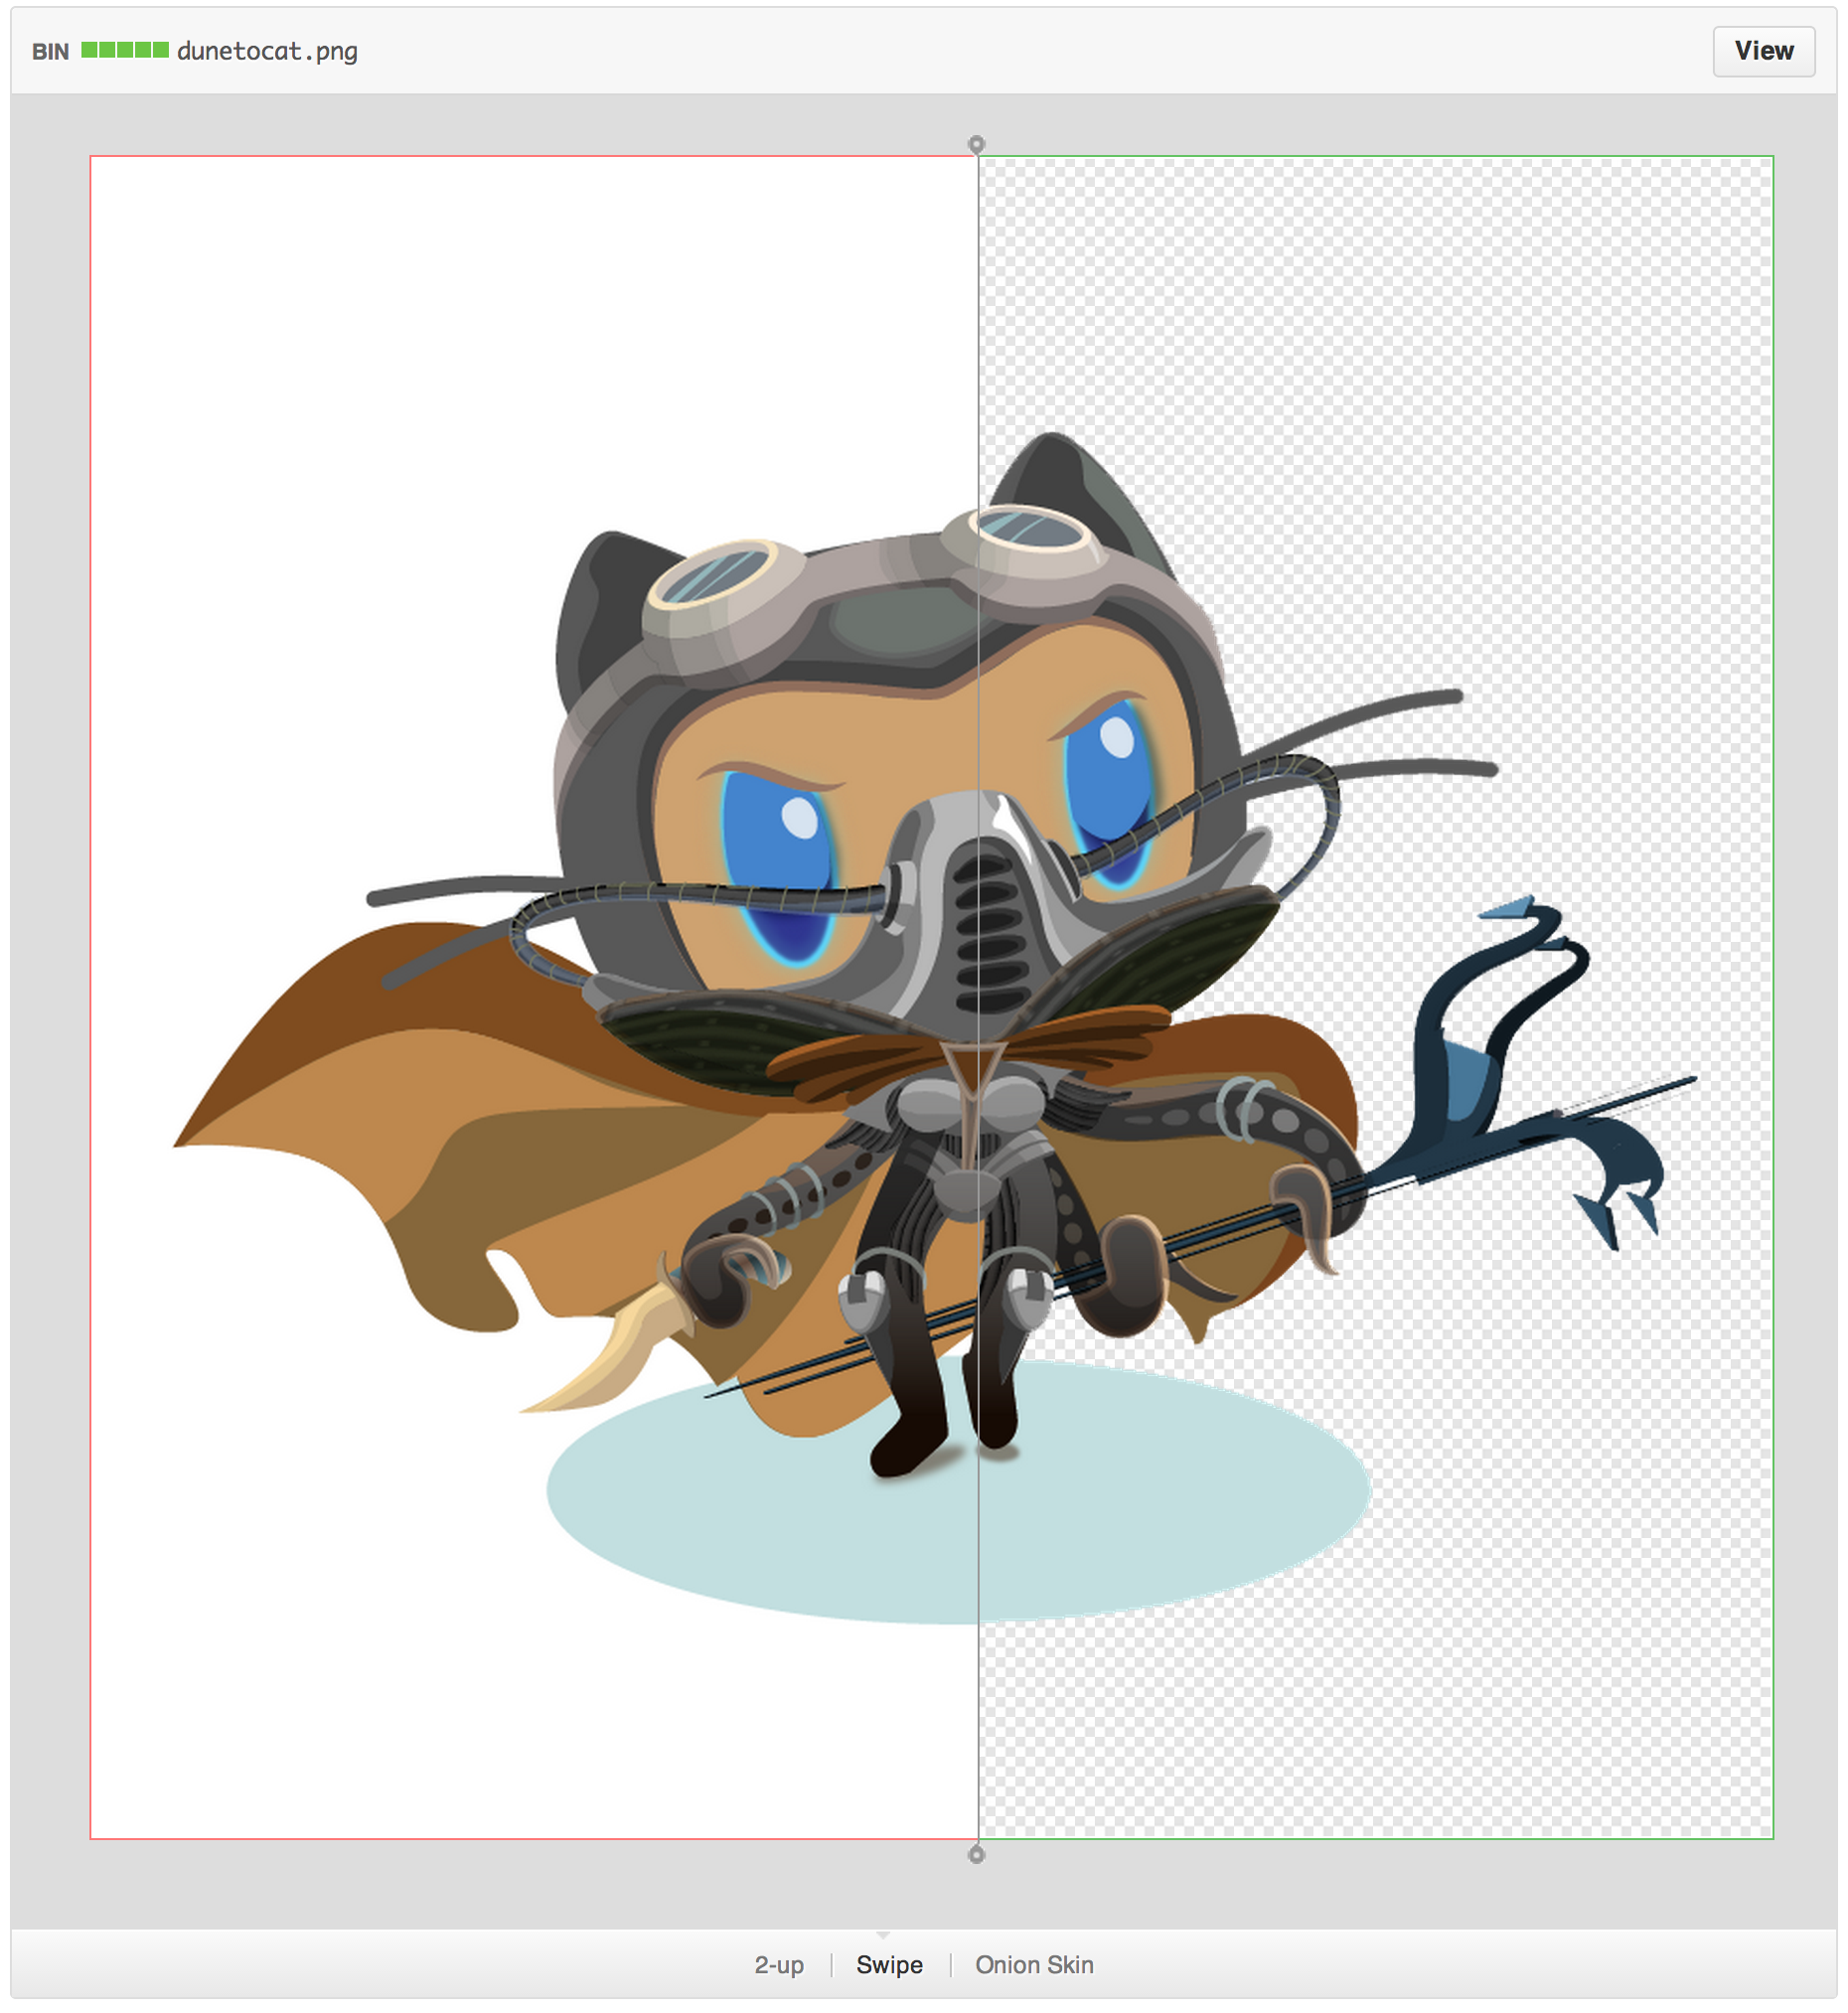
#### Swipe
**Swipe** lets you view portions of your image side by side. Not sure if colors shifted between different versions? Drag the swipe slider over the area in question and compare the pixels for yourself.
#### Onion skin
**Onion Skin** really comes in handy when elements move around by small, hard to notice amounts. Did an icon shift two pixels to the left? Drag the opacity slider back a bit and notice if things move around.
## 3D File Viewer
GitHub can host and render 3D files with the *.stl* extension.
When looking directly at an STL file on GitHub you can:
* Click and drag to spin the model.
* Right click and drag to translate the view.
* Scroll to zoom in and out.
* Click the different view modes to change the view.
### Fixing slow performance
If you see in the corner of the viewer, with the tooltip "WebGL powered hardware support not available," then the WebGL technology is not available on your browser.
WebGL is necessary to take advantage of your computer's hardware to its fullest. We recommend you try browsers like [Chrome](https://www.google.com/intl/en/chrome/browser/) or [Firefox](https://www.mozilla.org/en-US/firefox/new/), which ship with WebGL enabled.
### Error: "Unable to display"
If your model is invalid, GitHub may not be able to display the file. In addition, files that are larger than 10 MB are too big for GitHub to display.
### Embedding your model elsewhere
To display your 3D file elsewhere on the internet, modify this template and place it on any HTML page that supports JavaScript:
```html
```
For example, if your model's URL is [`github.com/skalnik/secret-bear-clip/blob/master/stl/clip.stl`](https://github.com/skalnik/secret-bear-clip/blob/master/stl/clip.stl), your embed code would be:
```html
```
By default, the embedded renderer is 420 pixels wide by 620 pixels high, but you can customize the output by passing height and width variables as parameters at the end of the URL, such as `?height=300&width=500`.
> \[!NOTE]
> `ref` can be a branch or the hash to an individual commit (like `2391ae`).
### Rendering in Markdown
You can embed ASCII STL syntax directly in Markdown. For more information, see [Creating diagrams](/en/enterprise-server@3.22/get-started/writing-on-github/working-with-advanced-formatting/creating-diagrams#creating-stl-3d-models).
## Rendering CSV and TSV data
GitHub supports rendering tabular data in the form of *.csv* (comma-separated) and .*tsv* (tab-separated) files.

When viewed, any *.csv* or *.tsv* file committed to a repository on GitHub automatically renders as an interactive table, complete with headers and row numbering. By default, we'll always assume the first row is your header row.
You can link to a particular row by clicking the row number, or select multiple rows by holding down the shift key. Just copy the URL and send it to a friend.
### Searching data
If you want to find a certain value in your dataset, you can start typing in the search bar directly above the file. The rows will filter automatically.
### Handling errors
Occasionally, you may discover that your CSV or TSV file isn't rendering. In those instances, a message appears above your raw text, suggesting what the error may be.

Common errors include:
* Mismatched column counts. You must have the same number of separators in each row, even if the cell is blank
* Exceeding the file size. Our rendering only works for files up to 512KB. Anything bigger than that slows down the browser.
* Using unsupported delimiters, such as semicolons instead of commas.
## Rendering PDF documents
GitHub supports rendering of PDF documents.
Currently, links within PDFs are ignored.
## Rendering differences in prose documents
Commits and pull requests that include prose documents have the ability to represent those documents with *source* and *rendered* views.
The source view shows the raw text that has been typed, while the rendered
view shows how that text would look once it's rendered on GitHub. For example,
this might be the difference between showing `**bold**` in Markdown, and **bold** in the rendered view.
Prose rendering is supported for rendered documents supported by [github/markup](https://github.com/github/markup):
* Markdown
* AsciiDoc
* Textile
* ReStructuredText
* Rdoc
* Org
* Creole
* MediaWiki
* Pod
To see the changes made to the document as part of a commit, click .

This "rich diff" highlights the code that has been added and removed.

### Disabling Markdown rendering
When viewing a Markdown file, you can click **Code** at the top of the file to disable Markdown rendering and view the file's source instead.

Disabling Markdown rendering enables you to use source view features, such as line linking, which is not possible when viewing rendered Markdown files.
### Visualizing attribute changes
We provide a tooltip describing changes to attributes that, unlike words, would not otherwise be visible in the rendered document. For example, if a link URL changes from one website to another, we'd show a tooltip like this: "href: /octo-org-repo/blob/CONTRIBUTING -> /octo-org/octo-repo/blob/docs/CONTRIBUTING."

### Commenting on changes
[Commit comments](/en/enterprise-server@3.22/pull-requests/collaborating-with-pull-requests/reviewing-changes-in-pull-requests/commenting-on-a-pull-request) can only
be added to files within the *source* view, on a line-by-line basis.
### Linking to headers
As with [other rendered prose documents](/en/enterprise-server@3.22/repositories/managing-your-repositorys-settings-and-features/customizing-your-repository/about-readmes),
hovering over a header in your document creates a link icon. You can link readers
of your rendered prose diff to specific sections.
### Viewing complex diffs
Some pull requests involve a large number of changes with large, complex documents. When the changes take too long to analyze, GitHub can't always produce a rendered view of the changes. If this happens, you'll see an error message when you click the rendered button.
You can still use the source view to analyze and comment on changes.
### Viewing HTML elements
We don't directly support rendered views of commits to HTML documents. Some formats, such as Markdown, let you embed arbitrary HTML in a document. When these documents are shown on GitHub, some of that embedded HTML can be shown in a preview, while some (like an embedded YouTube video) cannot.
In general, rendered views of changes to a document containing embedded HTML will show changes to the elements that are supported in GitHub's view of the document. Changes to documents containing embedded HTML should always be reviewed in both the rendered and source views for completeness.
## Mapping GeoJSON/TopoJSON files on GitHub
GitHub supports rendering GeoJSON and TopoJSON map files within GitHub repositories. Commit the file as you would normally using a `.geojson` or `.topojson` extension. Files with a `.json` extension are also supported, but only if `type` is set to `FeatureCollection`, `GeometryCollection`, or `topology`. Then, navigate to the path of the GeoJSON/TopoJSON file on GitHub.
### Geometry types
Maps on GitHub use [Leaflet.js](http://leafletjs.com) and support all the geometry types outlined in [the geoJSON spec](http://www.geojson.org/geojson-spec.html) (Point, LineString, Polygon, MultiPoint, MultiLineString, MultiPolygon, and GeometryCollection). TopoJSON files should be type "Topology" and adhere to the [TopoJSON spec](https://github.com/mbostock/topojson/wiki/Specification).
### Styling features
You can customize the way features are displayed, such as specifying a particular color or adding a descriptive icon, by passing additional metadata within the GeoJSON object's properties. The options are:
* `marker-size` - `small`, `medium`, or `large`
* `marker-color` - valid RGB hex color
* `marker-symbol` - an icon ID from [the Maki project](https://mapbox.com/maki/) or a single alphanumeric character (a-z or 0-9).
* `stroke` - color of a polygon edge or line (RGB)
* `stroke-opacity` - opacity of a polygon edge or line (0.0 - 1.0)
* `stroke-width` - width of a polygon edge or line
* `fill` - the color of the interior of a polygon (GRB)
* `fill-opacity` - the opacity of the interior of a polygon (0.0-1.0)
See [version 1.1.0 of the open simplestyle spec](https://github.com/mapbox/simplestyle-spec/tree/master/1.1.0) for more information.
### Embedding your map elsewhere
Want to make your GeoJSON map available someplace other than GitHub? Simply modify this template, and place it in any HTML page that supports JavaScript (for example, [GitHub Pages](https://pages.github.com)):
```html
```
For example, if your map's URL is [github.com/benbalter/dc-wifi-social/blob/master/bars.geojson](https://github.com/benbalter/dc-wifi-social/blob/master/bars.geojson), your embed code would be:
```html
```
By default, the embedded map 420px x 620px, but you can customize the output by passing height and width variables as parameters at the end, such as `?height=300&width=500`.
> \[!NOTE]
> `ref` can be a branch or the hash to an individual commit (like `2391ae`).
### Mapping in Markdown
You can embed GeoJSON and TopoJSON directly in Markdown. For more information, see [Creating diagrams](/en/enterprise-server@3.22/get-started/writing-on-github/working-with-advanced-formatting/creating-diagrams#creating-geojson-and-topojson-maps).
To display interactive maps, a site administrator must configure the feature for your GitHub Enterprise Server instance. For more information, see [Configuring interactive maps](/en/enterprise-server@3.22/admin/configuring-settings/configuring-user-applications-for-your-enterprise/configuring-interactive-maps).
### Clustering
If your map contains a large number of markers (roughly over 750), GitHub will automatically cluster nearby markers at higher zoom levels. Simply click the cluster or zoom in to see individual markers.
### Something's up with the underlying map
The underlying map data (street names, roads, etc.) are driven by [OpenStreetMap](http://www.openstreetmap.org/), a collaborative project to create a free editable map of the world. If you notice something's not quite right, since it's open source, simply [sign up](https://www.openstreetmap.org/user/new) and submit a fix.
### Troubleshooting GeoJSON/TopoJSON files
If you're having trouble rendering GeoJSON files, ensure you have a valid GeoJSON file by running it through a [GeoJSON linter](http://geojsonlint.com/). If your points aren't appearing where you'd expect (for example, in the middle of the ocean), it's likely that the data is in a projection which is currently unsupported. Currently, GitHub only supports the `urn:ogc:def:crs:OGC:1.3:CRS84` projection.
Additionally, if your `.geojson` file is especially large (over 10 MB), it is not possible to render within the browser. If that's the case, you'll generally see a message that says we can't show files that large.
It may still be possible to render the data by converting the `.geojson` file to [TopoJSON](https://github.com/mbostock/topojson), a compression format that, in some cases, can reduce filesize by up to 80%. Of course, you can always break the file into smaller chunks (such as by state or by year), and store the data as multiple files within the repository.
### Further reading about GeoJSON/TopoJSON
* [Leaflet.js documentation](https://leafletjs.com/)
* [MapBox marker-styling documentation](http://www.mapbox.com/developers/simplestyle/)
* [TopoJSON Wiki](https://github.com/mbostock/topojson/wiki)
## Working with Jupyter Notebook files on GitHub
When you add Jupyter Notebook or IPython Notebook files with a *.ipynb* extension on GitHub, they will render as static HTML files in your repository.
The interactive features of the notebook, such as custom JavaScript plots, will not work in your repository on GitHub. For an example, see [*Linking and Interactions.ipynb*](https://github.com/bokeh/bokeh-notebooks/blob/main/tutorial/06%20-%20Linking%20and%20Interactions.ipynb).
To view your Jupyter notebook with JavaScript content rendered or to share your notebook files with others you can use [nbviewer](https://nbviewer.jupyter.org/). For an example, see [*Linking and Interactions.ipynb*](https://nbviewer.jupyter.org/github/bokeh/bokeh-notebooks/blob/main/tutorial/06%20-%20Linking%20and%20Interactions.ipynb) rendered on nbviewer.
To view a fully interactive version of your Jupyter Notebook, you can set up a notebook server locally. For more information, see [Jupyter's official documentation](http://jupyter.readthedocs.io/en/latest/index.html).
### Troubleshooting Jupyter Notebook files
If you're having trouble rendering Jupyter Notebook files in static HTML, you can convert the file locally on the command line by using the [`nbconvert` command](https://github.com/jupyter/nbconvert):
```shell
jupyter nbconvert --to html NOTEBOOK-NAME.ipynb
```
### Further reading about Jupyter Notebook
* [Jupyter Notebook's GitHub repository](https://github.com/jupyter/jupyter_notebook)
* [Gallery of Jupyter Notebooks](https://github.com/jupyter/jupyter/wiki)
## Displaying Mermaid files on GitHub
GitHub supports rendering Mermaid files within repositories. Commit the file as you would normally using a `.mermaid` or `.mmd` extension. Then, navigate to the path of the Mermaid file on GitHub.
For example, if you add a `.mmd` file with the following content to your repository:
```text
graph TD
A[Friend's Birthday] -->|Get money| B(Go shopping)
B --> C{Let me think}
C -->|One| D["Cool Laptop"]
C -->|Two| E[iPhone]
C -->|Three| F[fa:fa-car Car]
```
When you view the file in the repository, it is rendered as a flow chart.

### Troubleshooting Mermaid files
If your chart does not render at all, verify that it contains valid Mermaid Markdown syntax by checking your chart with the [Mermaid live editor](https://mermaid.live/edit).
If the chart displays, but does not appear as you'd expect, you can create a new [GitHub Community discussion](https://github.com/orgs/community/discussions/categories/general), and add the `Mermaid` label.
#### Known issues
* Sequence diagram charts frequently render with additional padding below the chart, with more padding added as the chart size increases. This is a known issue with the Mermaid library.
* Actor nodes with popover menus do not work as expected within sequence diagram charts. This is due to a discrepancy in how JavaScript events are added to a chart when the Mermaid library's API is used to render a chart.
* Not all charts are a11y compliant. This may affect users who rely on a screen reader.
### Mermaid in Markdown
You can embed Mermaid syntax directly in Markdown. For more information, see [Creating diagrams](/en/enterprise-server@3.22/get-started/writing-on-github/working-with-advanced-formatting/creating-diagrams#creating-mermaid-diagrams).
### Further reading about Mermaid
* [Mermaid.js documentation](https://mermaid-js.github.io/mermaid/#/)
* [Mermaid.js live editor](https://mermaid.live/edit)