Note: Your site administrator must enable code scanning for your GitHub Enterprise Server instance before you can use this feature. If you want to use GitHub Actions to scan your code, the site administrator must also enable GitHub Actions and set up the infrastructure required. For more information, see "Configuring code scanning for your appliance."
About your code scanning setup
You can use a variety of tools to set up code scanning in your repository. For more information, see "Setting up code scanning for a repository."
The log and diagnostic information available to you depends on the method you use for code scanning in your repository. You can check the type of code scanning you're using in the Security tab of your repository, by using the Tool drop-down menu in the alert list. For more information, see "Managing code scanning alerts for your repository."
About analysis and diagnostic information
You can see analysis and diagnostic information for code scanning run using CodeQL analysis on GitHub.
Analysis information is shown for the most recent analysis in a header at the top of the list of alerts. For more information, see "Managing code scanning alerts for your repository."
Diagnostic information is displayed in the Action workflow logs and consists of summary metrics and extractor diagnostics. For information about accessing code scanning logs on GitHub, see "Viewing the logging output from code scanning" below.
If you're using the CodeQL CLI outside GitHub, you'll see diagnostic information in the output generated during database analysis. This information is also included in the SARIF results file you upload to GitHub with the code scanning results.
For information about the CodeQL CLI, see "Configuring CodeQL CLI in your CI system."
About summary metrics
摘要指� �包括:
- 在创建和提取 CodeQL 数据库之前,代� �库中的代� �行(用作基线)
- 从代� �中提取的 CodeQL 数据库中的代� �行,包括外部库和自动生成的文件
- CodeQL 数据库中的代� �行,不包括自动生成的文件和外部库
About CodeQL source code extraction diagnostics
提取器诊断仅涵盖分析期间看到的文件,指� �包括:
- 成功分析的文件数量
- 在创建数据库过程中生成提取器错误的文件数量
- 在创建数据库过程中生成提取器警告的文件数量
Viewing the logging output from code scanning
This section applies to code scanning run using GitHub Actions (CodeQL or third-party).
After setting up code scanning for your repository, you can watch the output of the actions as they run.
-
在� 的存储库名称下,单击 “操作”。
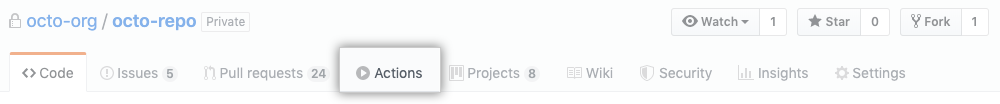
You'll see a list that includes an entry for running the code scanning workflow. The text of the entry is the title you gave your commit message.
-
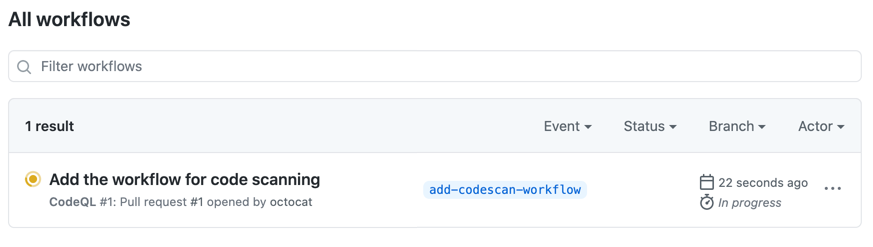
Click the entry for the code scanning workflow.
-
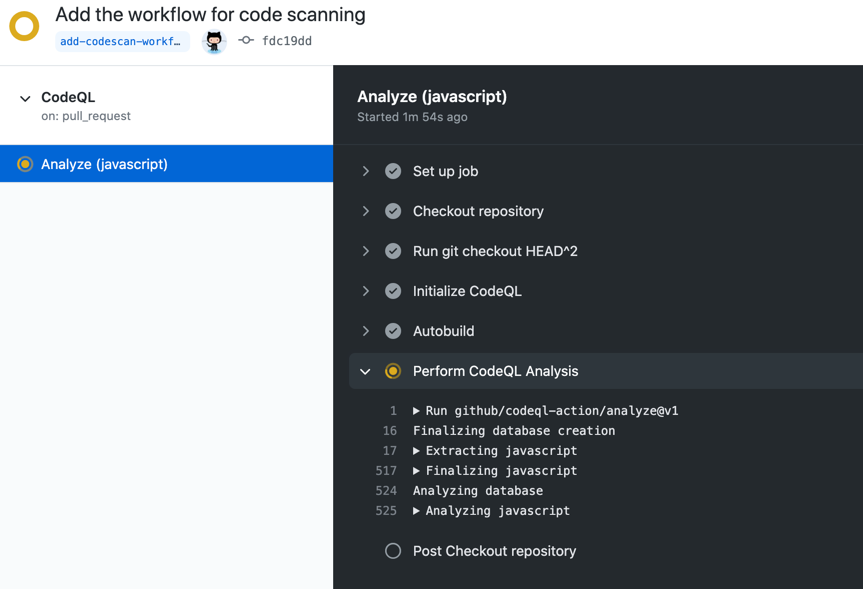
Click the job name on the left. For example, Analyze (LANGUAGE).
-
Review the logging output from the actions in this workflow as they run.
-
Once all jobs are complete, you can view the details of any code scanning alerts that were identified. For more information, see "Managing code scanning alerts for your repository."
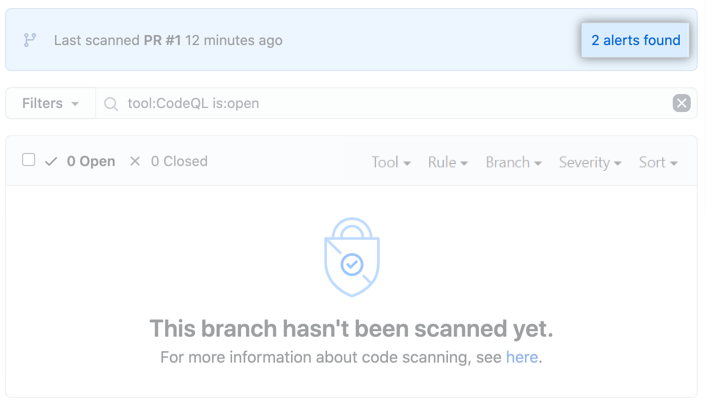
Note: If you raised a pull request to add the code scanning workflow to the repository, alerts from that pull request aren't displayed directly on the Code scanning page until the pull request is merged. If any alerts were found you can view these, before the pull request is merged, by clicking the n alerts found link in the banner on the Code scanning page.